
Tuesday, July 06, 2010
Bear Trend Renewed
Final confirmation of the renewed "Bear Trend" will be signaled at the close of Friday. That is, if the 13-week EMA stays below the 34-week EMA.


Sunday, July 04, 2010
Timing of Purchasing Inverse ETFs
From my post earlier today about purchasing inverse ETF indexes, such as SH, SDS, DXD, and TZA, I received several questions about the exact timing. First, the markets are very oversold on a daily basis. That is, the "Full Stochastics, Commodity Channel Index, and Williams %R are all oversold. I would expect a short-term bounce next week. Expecting such a bounce, I will be scaling in my purchases as such. Since the ETFs under consideration are leveraged between 200% and 300%, I plan on allocating only 30% to 35% of my portfolio into such instruments, with the remaining in Money Market Funds, preferably Treasury Bills for utmost safety. Second, I will update any of my daily investment activities, as always, on Twitter. You can follow me by clicking Twitter.
Enjoy your Fourth of July and do remember why we celebrate it.
Enjoy your Fourth of July and do remember why we celebrate it.
Generational Invesment Opportunites?
In my post yesterday, I mentioned that in my thirty plus years of using "Point and Figure Charts (P&F) that I have never seen as many perfect bearish set-ups for the various ETF indexes, such as DOG, SH, DXD, SDS, TWM, and TA, as I have seen in the past week. So, why do I like P&F charts so much? In using these types of charts, I am privy to visualizing the four main phases that all indexes and stocks go through during a typical market cycle. The four phases are accumulation, advancing, distribution, and declining.
The following Point and Figure Charts are illustrations for assisting you in identifying Phase 2 - Advancing: 
In regard to SDS, I plan on purchasing at $39 or better with a stop at $34.97.

In regard to SH, I plan on purchasing at $56 or better with a stop at $51.97.

In regard to TZA, I plan on purchasing at $8.75 or better with a stop at $6.47.
I also like DXD at $32 or better with a stop at $27.97.
As I mentioned, I do consider these inverse index ETFs as generational investment opportunities that are definitely worth the risk, which I am willing to take.
Saturday, July 03, 2010
S&P 500 Update for July 2, 2010
Let's review the "Exponential Moving Average (EMA) Strategy. The investment parameters for this strategy are very simple. Go long when the 13(15)-week EMA is greater (crosses above) than the 34 (40)-week EMA. Go short when the when the 13 (15)-week EMA is less (crosses below) that the 34 (40)-week EMA. Ok, what is the strategy currently saying? Answer: The trend is still bullish but barely. The 13- and 34-week EMAs have readings of 1100.56 and 1099.03, respectively. The 15- and 40-week EMAs have readings of 1103.67 and 1093.82, respectively. Therefore, the time has come that you definitely want to prepare yourself for a potential "cross over to bearish trend." [Sidebar: In my thirty plus years of using Point & Figure Charts, I have never seen as many "perfect" bearish set-ups for the various ETFs indexes as I have seen in the past week. That in itself is scary. I will follow-up with some of these charts over the next two day.]
Some of the inverse ETFs that I am currently following are as follows: DOG, SH, DXD, SDS, TZA, TWM, and QID.

Some of the inverse ETFs that I am currently following are as follows: DOG, SH, DXD, SDS, TZA, TWM, and QID.

Friday, July 02, 2010

Thursday, July 01, 2010

Tuesday, June 29, 2010
S&P 500 Update for June 29, 2010
You better get that magnifying glass out to see if the 13-week EMA is above to penetrate the 34-week EMA. Today, I was stopped out of my remaining 40% position in SPY at $104.24, which was my average cost. Therefore, my investment portfolio is now 100% in cash.
Where do we go from here? My response is based on what the market is currently telling me. It is saying that the majority of indexes are either currently in the latter Stage 3 (Distribution Phase) or early Stage 4 (Declining Phase). This analysis is based on Point & Figure Charts of the various market indexes.

Where do we go from here? My response is based on what the market is currently telling me. It is saying that the majority of indexes are either currently in the latter Stage 3 (Distribution Phase) or early Stage 4 (Declining Phase). This analysis is based on Point & Figure Charts of the various market indexes.

Monday, June 28, 2010

SLV: Neither Bear nor Bull!
I know that a lot of you that follow my blog are very interested in the precious metals. That is why from time to time I have updates pertaining to GLD, SLV, and GDX. Today, I want to illustrate a "Point and Figure Chart of SLV, which is as follows:

From a technical analysis perspective, these are my findings for SLV, which are based on the above chart:

From a technical analysis perspective, these are my findings for SLV, which are based on the above chart:
- Bullish uptrend since November 2008 (Green Line)
- Cyclical Position for SLV: Late Advancing Phase/Early Distribution Phase
- Major support at $17, which also corresponds to its 200-day EMA at $16.91
- Price break of $17 would be the start of the Declining Phase.
- Price break of $17 would give a downside price objective between $12 to $14. $14 is the February 2010 low.
Wednesday, June 23, 2010
Obama Administration Knew About Deepwater Horizon 35,000 Feet Well Bore
According to Oil Price, President Obama and Secretary of Interior Ken Salazar, Secretary of Energy Steven Chu, and Defense Secretary Robert Gates were informed that BP would drill an unprecedented 35,000 feet well bore at the Macondo site off the coast of Louisiana. In September 2009, the Deepwater Horizon successfully sunk a well bore at a depth of 35,055 below sea level at the Tiber Prospect in the Keathley Canyon block 102 in the Gulf of Mexico, southeast of Houston.
During the September drilling operations, the Deepwater Horizon drill penetrated a massive undersea oil deposit but BP's priorities changed when the Macondo site in the Mississippi Canyon off the coast of Louisiana was found to contain some 3-4 billion barrels of oil in an underground cavern estimated to be about the size of Mount Everest. It was as a result of another 35,000 feet well bore sank by the Deepwater Horizon at the Macondo site that the catastrophic explosion occurred on April 20.
According to the Wayne Madsen Report (WMR) sources within the U.S. Army Corps of Engineers and the Federal Emergency Management Agency (FEMA), the Pentagon and Interior and Energy Departments told the Obama Administration that the newly-discovered estimated 3-4 billion barrels of oil in the Gulf of Mexico would cover America's oil needs for up to eight months if there was a military attack on Iran that resulted in the bottling up of the Strait of Hormuz to oil tanker traffic, resulting in a cut-off of oil to the United States from the Persian Gulf.
Obama, Salazar, Chu, and Gates green-lighted the risky Macondo drilling operation from the outset, according to WMR's government sources.
WMR learned that BP was able to have several safety checks waved because of the high-level interest by the White House and Pentagon in tapping the Gulf of Mexico bonanza find in order to plan a military attack on Iran without having to be concerned about an oil and natural gas shortage from the Persian Gulf after an outbreak of hostilities with Iran.
BP still has an ongoing operation to drill down to 40,000 feet below sea level at the Liberty field off the north coast of Alaska.
During the September drilling operations, the Deepwater Horizon drill penetrated a massive undersea oil deposit but BP's priorities changed when the Macondo site in the Mississippi Canyon off the coast of Louisiana was found to contain some 3-4 billion barrels of oil in an underground cavern estimated to be about the size of Mount Everest. It was as a result of another 35,000 feet well bore sank by the Deepwater Horizon at the Macondo site that the catastrophic explosion occurred on April 20.
According to the Wayne Madsen Report (WMR) sources within the U.S. Army Corps of Engineers and the Federal Emergency Management Agency (FEMA), the Pentagon and Interior and Energy Departments told the Obama Administration that the newly-discovered estimated 3-4 billion barrels of oil in the Gulf of Mexico would cover America's oil needs for up to eight months if there was a military attack on Iran that resulted in the bottling up of the Strait of Hormuz to oil tanker traffic, resulting in a cut-off of oil to the United States from the Persian Gulf.
Obama, Salazar, Chu, and Gates green-lighted the risky Macondo drilling operation from the outset, according to WMR's government sources.
WMR learned that BP was able to have several safety checks waved because of the high-level interest by the White House and Pentagon in tapping the Gulf of Mexico bonanza find in order to plan a military attack on Iran without having to be concerned about an oil and natural gas shortage from the Persian Gulf after an outbreak of hostilities with Iran.
BP still has an ongoing operation to drill down to 40,000 feet below sea level at the Liberty field off the north coast of Alaska.
New Home Sales Plunged in May
This is not good economic news. According to the Commerce Department, the sharp decline in housing sales was worse than expected. Sales were down across all four regions. Economists surveyed by Dow Jones Newswires had estimated sales would fall 20.6% to 400,000 because of the April 30 end of a tax credit for first-time buyers that was enacted in February 2009 and extended. The level of 300,000 homes sold was the lowest since the government begin compiling this data in 1963. The 32.7% decrease was also a record.
Tuesday, June 22, 2010
Who Knew What and When About the BP Problem?
It is being reported that the Deepwater Horizon problem started way back on February 13. To make matters worse, this Administration knew about the issue. However, there was no public dissemination of this information. The following are some excerpts from the article:
Finally, Tony Hayward, CEO, liquidated about a third of his holding in the company one month before the Deepwater Horizon disaster. Superb market timing, or did he use insider information to benefit from this knowledge?
- It seems incomprehensible that the president and other members of the administration still have jobs when it is now being reported that the federal government was apprised by BP on February 13 that the Deepwater Horizon oil rig was leaking oil and natural gas into the ocean floor.
- In fact, according to documents in the administration's possession, BP was fighting large cracks at the base of the well for roughly ten days in early February.
- Further it seems the administration was also informed about this development, six weeks before to the rig's fatal explosion when an engineer from the University of California, Berkeley, announced to the world a near miss of an explosion on the rig by stating, "They damn near blew up the rig."
Finally, Tony Hayward, CEO, liquidated about a third of his holding in the company one month before the Deepwater Horizon disaster. Superb market timing, or did he use insider information to benefit from this knowledge?
Monday, June 21, 2010

Tuesday, June 15, 2010
Ignorance is not Bliss
For those of you that live in Illinois or know someone that does, you may want to move. The reason because as a state resident of that fine state you are going to be on the hook for $45 billion. You may ask, how so? Illinois Teachers Retirement System's, after losing $4.4 billion on investments in fiscal year 2009, and 5 percent on investments in fiscal 2008, pension is now underfunded by $44.5 billion, or 60.9 percent, according to the Commission on Government Forecasting and Accountability’s March 2010 report. That is, it has 40 cents of every dollar they need. In other words, if you are a teacher in Illinois, your "PENSION" is dead. If you are a taxpayer in Illinois, please bend over!
For the full report, here is the link! Oh, my the way, the investments of choice were those credit default swaps (CDS), or derivative vehicles.
For the full report, here is the link! Oh, my the way, the investments of choice were those credit default swaps (CDS), or derivative vehicles.
A Family Affair
If the government can insist that your children are on the hook for all that federal debt outstanding, I guess you can likewise:


Monday, June 14, 2010
Fannie-Freddie Fix at $160 Billion With $1 Trillion Worst Case
With each passing day, I become more and more "Bearish," not only on our economy but also the stock market. A prime example of my bearish stance is taken from Bloomberg this morning: "The cost of fixing Fannie Mae and Freddie Mac, the mortgage companies that last year bought or guaranteed 75% of all U.S. home loans, will be at least $160 billion and could grow to as much as $1 trillion after the biggest bailout in American history." To keep things in perspective consider the following facts: "First, Fannie and Freddie, now 80 percent owned by U.S. taxpayers, already have drawn $145 billion from an unlimited line of government credit granted to ensure that home buyers can get loans while the private housing-finance industry is moribund. That surpasses the amount spent on rescues of AIG, GM (Government Motors), or Citigroup. Second, Fannie and Freddie own or guarantee 53 percent of the nation’s $10.7 trillion in residential mortgages, according to a June 10, 2010 Federal Reserve report. Millions of bad loans issued during the housing bubble remain on their books, and delinquencies continue to rise."
I believe the worst case scenario of $1 trillion will occur. What is the solution? We must simply return to the days when the standard was for mortgagees to put 20% down. What is the probability of the that happening? Probably, zero.
Then, President Barack Obama sends a letter to Congress over the weekend urging them urging them to approve a tax and spending bill currently being debated in the Senate that already would add $80 billion to our nation's budget deficit. He also requested another $50 billion in deficit spending earmarked for bailing-out state and local governments. Without this "emergency" money, the President claims thousands of government union jobs would be lost. (Yes, you read that correctly. It is all about saving union jobs. Mr. President, what about non-union jobs? Oh, I see now. You want to unionize all jobs.)
Folks, this deficit spending must stop in order to save our Republic. We simply can not continue to have deficit spending that amounts to 10% to 12% of GDP. Once again, the solution is simple. That is, cut spending!
I believe the worst case scenario of $1 trillion will occur. What is the solution? We must simply return to the days when the standard was for mortgagees to put 20% down. What is the probability of the that happening? Probably, zero.
Then, President Barack Obama sends a letter to Congress over the weekend urging them urging them to approve a tax and spending bill currently being debated in the Senate that already would add $80 billion to our nation's budget deficit. He also requested another $50 billion in deficit spending earmarked for bailing-out state and local governments. Without this "emergency" money, the President claims thousands of government union jobs would be lost. (Yes, you read that correctly. It is all about saving union jobs. Mr. President, what about non-union jobs? Oh, I see now. You want to unionize all jobs.)
Folks, this deficit spending must stop in order to save our Republic. We simply can not continue to have deficit spending that amounts to 10% to 12% of GDP. Once again, the solution is simple. That is, cut spending!
Friday, June 11, 2010
Are You Ready for the "Bear?"
The following S&P 500 chart illustrates the exponential moving average (EMA) strategy utilizes the 13-week EMA and and 34-week EMA. It is simply an extension, so to speak, of the 15- and 40-week EMAs that I update on a weekly basis. The only difference, of course, is time. The 13- and 34-week EMAs are a little more sensitive, simply because of the shorter time frame. Also, I have included the PPO indicator. I use the PPO indicator as my confirmation to the EMA strategy. Notice what is happening to the EMAs and the PPO. The 13-week EMA has turned down and nearing the 34-week EMA. Also, the PPO has likewise turned down and closing in on "0."
My advice is you better be very caution in the market near term. The "Bear" might just be coming out of hibernation.

My advice is you better be very caution in the market near term. The "Bear" might just be coming out of hibernation.

Thursday, June 10, 2010
Tuesday, June 08, 2010

Monday, June 07, 2010
Start of a New "Bear Market?"
Point and Figure (P&F) Charts are excellent tools for identifying what phase (cycle) the market is in for any give time frame. There are four phases to any market cycle. The accumulating phase, advancing phase (bull market), distributing phase, and declining phase (bear market). The following chart depicts the various phases that the market has gone through over the past year. I have used BGU for this illustration. (BGU seeks daily investment results, before fees and expenses, of 300% of the performance of the Russell 1000 (Large Cap) index.)

That proverbial bottom-line is that the market has just entered the declining phase (Bear) when the major support (Green) line was penetrated on the down side. I plan on using any market strength to exit my remaining SPY (40%) positions (unless stopped out) and start accumulating inverse ETFs, such as DXD, SDS, QID, and TZA.

That proverbial bottom-line is that the market has just entered the declining phase (Bear) when the major support (Green) line was penetrated on the down side. I plan on using any market strength to exit my remaining SPY (40%) positions (unless stopped out) and start accumulating inverse ETFs, such as DXD, SDS, QID, and TZA.
Weekly S&P 500 EMA Strategy Updates Along with TNA & TZA
The weekly EMA strategy is still in a bullish trend as denoted by the 15-week EMA > 40-week EMA. However, both EMAs have turned down along with the RSI being below 50. (See the following chart.)

The next chart is TNA (3x Small Cap Bull ETF).

The last chart is TZA (3x Small Cap Bear ETF); which, of course, is a mirror image of TNA.


The next chart is TNA (3x Small Cap Bull ETF).

The last chart is TZA (3x Small Cap Bear ETF); which, of course, is a mirror image of TNA.

Wednesday, June 02, 2010
A Tale of Two ETFs (TNA and TZA)
I am still waiting for TNA's PPO to turn positive before I reinstitute my position. See the following chart for specifics.


The mirror image of TNA is TZA. See its chart as follows:

Sunday, May 30, 2010
S&P 500 Weekly Update for May 28, 2010
The EMA strategy continues to favor the bullish case, since 15-week EMA > 40-week EMA. Refer to the following chart. I continue to hold 40% of my "investment account" in SPY with a stop at my entry price of $104.24. As of Friday, the closing price for SPY was $109.37, which is 4.9% above my entry price. (Refer to my posts of May 9 and 10 for my investment rationale at this time.)
Currently, I am long FXE (Euro) and short the dollar through UDN (inverse $ ETF). In addition, I am long the TNA (3x Small Cap Bullish ETF).

Currently, I am long FXE (Euro) and short the dollar through UDN (inverse $ ETF). In addition, I am long the TNA (3x Small Cap Bullish ETF).

Friday, May 28, 2010
True Meaning of Memorial Day!
Let's not forget to give thanks this weekend to the countless number of individuals that served and died courageously for the freedom that we enjoy today. Freedom does have a price; and sadly for many, it has been their lives. I want to thank each of you who have served this country.
So, You Want to Buy Gold
You know that gold is near at least a short-term top when when you can purchase gold from a vending machine, as in Abu Dhabi, or sell gold to your barber.


Thursday, May 27, 2010

Sunday, May 23, 2010

Saturday, May 22, 2010
Weekly Investment Activities
For those of you who follow me on Twitter, know that is where my daily investment activities and thoughts are posted. As of Friday, May 21, my investment position is basically neutral. That is, I am out of my shorts [DXD (Ultra-short on DJIA) and DZZ (Ultra-short on Gold)]. The DXD trade was purchased on May 10 for an 11.91% profit. The DZZ trade was purchased on May 17 for an 8.81% profit. I did take a position on UNG (Natural Gas Fund) on Friday and quickly sold it for a 2.51% loss. (I don't know why I even bother with natural gas. It has never been kind to me.) I am still long FXE (Euro) at $123.23 with a stop at $120.51. That position has a unrealized gain of 1.73%. The price objective (IMHO) for the FXE trade is $129-$130.
Overall, I am still bearish; however, the market is due for a bounce after declining 4% this week, which is the rationale for selling my bearish positions. I plan to reinstitute the DXD position and probably add SDS and TWM to it when this rally runs its course.
For those of you that track the exponential moving average (EMA) strategy, I will have that updated later this weekend.
Overall, I am still bearish; however, the market is due for a bounce after declining 4% this week, which is the rationale for selling my bearish positions. I plan to reinstitute the DXD position and probably add SDS and TWM to it when this rally runs its course.
For those of you that track the exponential moving average (EMA) strategy, I will have that updated later this weekend.
Q&A Relating to the Global Financial Crisis
Click here but no embedding options. It's a satire but very profound. Enjoy!
Sunday, May 16, 2010
It's Just not Greece!
 Note: To enlarge, double-click inside of it.
 Not one single country in the EU is in compliance with its Stability and Growth Pact, which limits budget deficits to 3% of GDP. (In other words, where is the incentive for any country to be in compliance? Answer: Absolutely none. If the pact was enforced, it would discipline every single country for allowing its deficits to exceed the pact. What a joke!) And what is the EU's solution? Simply more debt, which is totally insane. You don't cure a debt problem with more debt. You just buy a little bit of time! And, that is what the EU has done. You may want to consider buying the following ETFs: EPV (200% short the MSCI -- Europe Index) and EUO (Ultra-short 200% Euro).
S&P 500 Weekly Update for May 14, 2010

For those of you following the EMA Strategy, stay the course. Be prepared for a test of 1,100 on the S&P 500, which, of course, is the 40-week EMA.
Monday, May 10, 2010
DXD (Ultra-short DJIA)
I redeployed a third of the proceeds from the SPY trade this morning with a position in DXD at an average cost of $26.54. I am still interested in SDS and TWM.
Fannie Mae: Some Things Just Don't Change
Fannie Mae has again asked Mr. and Mrs. Taxpayers for more money after reporting a first-quarter loss of more than $13 billion. They have lost $137 billion so far and keep adding to it quarter after quarter, and are still allowed to operate. Don't you just love these government run businesses? Isn't America great?
Fannie Mae, which was rescued by Mr. and Mrs. Taxpayer, in September 2008, said it needs an additional $8.4 billion from the government to help cover mounting losses. Why not, if Mr. and Mrs. Taxpayer has given billions to Greece, the least they can do is give $8 billion to Fannie. Right? (I should point out that Mr. and Mrs. Taxpayers only constitute 52% of Americans that pay Federal Income Taxes. For those of us that have this elite status, our taxes are going to sky-rocket!)
Fannie Mae, which was rescued by Mr. and Mrs. Taxpayer, in September 2008, said it needs an additional $8.4 billion from the government to help cover mounting losses. Why not, if Mr. and Mrs. Taxpayer has given billions to Greece, the least they can do is give $8 billion to Fannie. Right? (I should point out that Mr. and Mrs. Taxpayers only constitute 52% of Americans that pay Federal Income Taxes. For those of us that have this elite status, our taxes are going to sky-rocket!)
SPY: Pre-Market
I just sold my 60% position (pre-market) in SPY at $116.02. For the remaining 40% position, I have changed by sell-stop order from break-even ($104.24) to $110.95, which is 5% below its 50-day SMA of $117.10.
For the Love of Greece!
The International Monetary Fund (IMF) is lending Greece about piece $286 billion. Since the United States is "required" to contribute 17% of the IMF's funding, this means that you, Mr. and Mrs. Taxpayer, have just been hit for $48.6 billion to cover Greece's debts. In other words, the solution to a debt crisis is to pile on more debt at your expense, Mr. and Mrs. Taxpayer.
But, it even gets better for Mr. and Mrs. Taxpayer. The Federal Reserve System's "swaplines" have been reopened, which could conceivably pay for part or all of the European Central Bank foreign bond buying of up to $1 trillion. The Fed said that these facilities are designed to help improve liquidity conditions in U.S. dollar funding markets. (Wait a minute! The dollar is not under pressure. It is the Euro.) The arrangement with the ECB will provide them with the capacity to conduct tenders of U.S. dollars fro the Euro at fixed rates. And get this, these swap arrangements have been authorized through January 2011.
The DJIA in pre-market trading is up close to 400 points. Wow! The markets are loving it. That's right. Just pile on more and more debt. Its gotta work, right? My investment strategy has not changed from yesterday. I will liquidate 60% of my SPY positions and start to redeploy the investment proceeds into the following ultra-short ETFs (DXD, SDS, and TWM).
But, it even gets better for Mr. and Mrs. Taxpayer. The Federal Reserve System's "swaplines" have been reopened, which could conceivably pay for part or all of the European Central Bank foreign bond buying of up to $1 trillion. The Fed said that these facilities are designed to help improve liquidity conditions in U.S. dollar funding markets. (Wait a minute! The dollar is not under pressure. It is the Euro.) The arrangement with the ECB will provide them with the capacity to conduct tenders of U.S. dollars fro the Euro at fixed rates. And get this, these swap arrangements have been authorized through January 2011.
The DJIA in pre-market trading is up close to 400 points. Wow! The markets are loving it. That's right. Just pile on more and more debt. Its gotta work, right? My investment strategy has not changed from yesterday. I will liquidate 60% of my SPY positions and start to redeploy the investment proceeds into the following ultra-short ETFs (DXD, SDS, and TWM).
Sunday, May 09, 2010
Weekly Update: Exponential Moving Average (EMA) Strategy for the S&P 500
The week was not kind to equity holders. Please review my comments within the following chart:
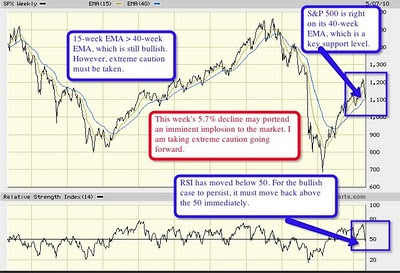 Note: To enlarge the chart, double-click inside of it.
Since September 21, 2009, I have been 100% long SPY in my investment account with an average price of $104.24. As of Friday, May 7, SPY closed at $111.26, which is a gain of 6.73% from my average price of $104.24. My strategy for Monday, May 11, is to sell 60% of my SPY holdings. With the remaining 40%, I will place a sell-stop order at break even ($104.24). With the 60%, I will start to acquire 20% positions in each of the following ultra-inverse ETFs: DXD (Ultra-short DJIA), SDS (Ultra-short S&P 500), and TWM (Ultra-short Russell 2000 Small Cap). Once again, this is my strategy, which is high risk, for my investment account. It is not a recommendation. You have to decide your own risk tolerance. Those of you that have been utilizing the EMA strategy and are comfortable with it, I would recommend that you continue to invest according to the 15-week EMA and 40-week EMA game plan.
 Note: To enlarge the chart, double-click inside of it.
Since September 21, 2009, I have been 100% long SPY in my investment account with an average price of $104.24. As of Friday, May 7, SPY closed at $111.26, which is a gain of 6.73% from my average price of $104.24. My strategy for Monday, May 11, is to sell 60% of my SPY holdings. With the remaining 40%, I will place a sell-stop order at break even ($104.24). With the 60%, I will start to acquire 20% positions in each of the following ultra-inverse ETFs: DXD (Ultra-short DJIA), SDS (Ultra-short S&P 500), and TWM (Ultra-short Russell 2000 Small Cap). Once again, this is my strategy, which is high risk, for my investment account. It is not a recommendation. You have to decide your own risk tolerance. Those of you that have been utilizing the EMA strategy and are comfortable with it, I would recommend that you continue to invest according to the 15-week EMA and 40-week EMA game plan.
Saturday, May 08, 2010
Market Plunge Baffles Wall Street, Really?
If you have been "MIA" over the past several days, you might be wondering what happen to the market this week, especially on Thursday. Thursday was the day that the DJIA had its biggest "intraday" point drop of nearly 1,000 in its history. For the week, the DJIA dropped 628.18, or down 5.7%, which was the steepest drop since the week ended October 10, 2008, in the midst of the financial crisis. Why? There were the usual excuses. The one that I really like is "somebody's wayward finger got in the way." The rumor goes that a trader error was the cause of the fiasco. That is, the trader had mistakenly entered an order for $16 billion, instead of $16 million. Then, of course, you have the Greece situation and our own debt woes, which were nothing new to the market.
I, for one, like to look at various technical indicators for possible clues for the drop. (By the way, I will update the exponential moving average strategy for the S&P 500 later today.) Several of these indicators are as follows:
1. Mutual funds currently show only 3.5% cash. Everything else is invested. This 3.5% matches the all time low, which occurred in July 2007. If you forgot about July 2007, that is when the DJIA plus Dow Transports made its all time high.
2. The VIX, a measure of volatility on option premiums, has been around its lowest level since May 2008.
3. The DJIA's dividend yield is 2.5%. The only market tops of the past century at which the dividend year was lower are those of 2000 and 2007, 1.4% and 2.1%, respectively.
4. The P/E ratio for the S&P 500, using four-quarter trailing real earnings, is 23, which is in the area of market peaks. As a point of reference, P/E ratios of 6 or 7 occur at major market lows.
So, where do we go from here? I believe, for what it is worth, that the bear market rally from March 2009 has ended. This bear-market rally was fueled by the FED's quantitative easing policy that injected close to a trillion dollars of liquidity into the financial system, which ended up in financial assets, like equities, not in productive loans to sustain an economic recovery. In other words, the FED's stimulative activities have been a total failure, except for Wall Street. Thursday's action (IMHO) is a precursor for further market declines. I will be taking some very defensive and bearish measures near term to position by portfolio for the ensuring bear market. As indicated, I will update the S&P 500 exponential moving average strategy along with some bearish ideas later this weekend.
I, for one, like to look at various technical indicators for possible clues for the drop. (By the way, I will update the exponential moving average strategy for the S&P 500 later today.) Several of these indicators are as follows:
1. Mutual funds currently show only 3.5% cash. Everything else is invested. This 3.5% matches the all time low, which occurred in July 2007. If you forgot about July 2007, that is when the DJIA plus Dow Transports made its all time high.
2. The VIX, a measure of volatility on option premiums, has been around its lowest level since May 2008.
3. The DJIA's dividend yield is 2.5%. The only market tops of the past century at which the dividend year was lower are those of 2000 and 2007, 1.4% and 2.1%, respectively.
4. The P/E ratio for the S&P 500, using four-quarter trailing real earnings, is 23, which is in the area of market peaks. As a point of reference, P/E ratios of 6 or 7 occur at major market lows.
So, where do we go from here? I believe, for what it is worth, that the bear market rally from March 2009 has ended. This bear-market rally was fueled by the FED's quantitative easing policy that injected close to a trillion dollars of liquidity into the financial system, which ended up in financial assets, like equities, not in productive loans to sustain an economic recovery. In other words, the FED's stimulative activities have been a total failure, except for Wall Street. Thursday's action (IMHO) is a precursor for further market declines. I will be taking some very defensive and bearish measures near term to position by portfolio for the ensuring bear market. As indicated, I will update the S&P 500 exponential moving average strategy along with some bearish ideas later this weekend.
Wednesday, May 05, 2010
Private Sector Adds 32,000 Jobs
Automatic Data Processing Inc. (ADP) reported today that private payrolls grew in April by 32,000, while layoff announcements fell to a near 4-year low. At least the addition of 32,000 private sector jobs is somewhat good news. The reason I say somewhat good news is that the U.S. needs to create about 150,000 jobs each month in order to simply balance the incoming supply of workers.
What I like about the ADP survey is that it tallies only private-sector jobs, while the Bureau of Labor Statistics' nonfarm payroll data, which is to be released this Friday, include government workers. That is why my focus is always on the ADP monthly survey, because it surveys the creation of jobs in the private sector.
What I like about the ADP survey is that it tallies only private-sector jobs, while the Bureau of Labor Statistics' nonfarm payroll data, which is to be released this Friday, include government workers. That is why my focus is always on the ADP monthly survey, because it surveys the creation of jobs in the private sector.
Primer on How Goldman Sachs Used Credit Default Swaps
 Note: To enlarge picture, double-click inside of it.
Monday, April 26, 2010
Caterpillar Swings to Profit; Where are the Revenues?
Caterpillar swung to a profit in the 2010 first quarter, citing improved economic conditions, particularly in emerging markets. But wait, revenues fell 11%. Remember, the first quarter of 2009 was the depth of the recession, the so-called bottom. Everything has to be better when compared to the first quarter of 2009. Profits are up; but, wait a minute, revenues are down. (I thought we were in a robust macro-economic recovery as the New York Times tell it.) How can that be? Oh, Caterpillar improved its profit due to firing huge numbers of people. Now, I clearly see what has happened. And, it does not portend well for a turn-around in construction equipment sales, nor for a sustainable economic recovery.
Friday, April 23, 2010
Cash for Tanners: A New Subsidy for Vacations
Have Europeans lost their minds or what? According to European Commissioner Antonio Tajani, visiting foreign countries is a "right." Yes, vacations are no longer a privilege but a right of all. The EU has a new "Social Tourism" project that advocates subsidized holidays for the underprivileged. Cash for tanners is also being touted as good economic policy. Has anyone in Europe taken a basic economics course? If not, they should enroll in one of my economic courses! (Once again, I am just not that creative to make this stuff up.)
This project targets the disabled, poor families, senior citizens and, youth. (By the way, in Europe a youth includes an individual up to 30 years of age.) At an EU meeting last week, Spanish Tourism Minister Miguel Sebastian said tourism "should be an asset all citizens can enjoy, in particular those with physical disabilities or financially disadvantaged." Now, I know why Spain is in that category of countries referred as "PIIGS."
Currently, "Social Tourism" is being touted only in Europe. However, I am confident that "Cash for Tanners" will soon find its way to our shores. If I were you, I would be getting vacation brochures from your local travel agencies. I know, I am.
This project targets the disabled, poor families, senior citizens and, youth. (By the way, in Europe a youth includes an individual up to 30 years of age.) At an EU meeting last week, Spanish Tourism Minister Miguel Sebastian said tourism "should be an asset all citizens can enjoy, in particular those with physical disabilities or financially disadvantaged." Now, I know why Spain is in that category of countries referred as "PIIGS."
Currently, "Social Tourism" is being touted only in Europe. However, I am confident that "Cash for Tanners" will soon find its way to our shores. If I were you, I would be getting vacation brochures from your local travel agencies. I know, I am.
Tuesday, April 20, 2010
Pay People for not Working, More People will not Work!
Who made the following three statements? You just might be surprised when you find out!
"To fully understand unemployment, we must consider the causes of recorded long-term unemployment. Empirical evidence shows that two causes are welfare payments and unemployment insurance. These government assistance programs contribute to long-term unemployment."
"Government assistance increases the measure of unemployment by prompting people who are not working to claim that they are looking for work even when they are not. The work-registration requirement for welfare recipients, for example, compels people who otherwise would not be considered part of the labor force to register as if they were a part of it."
"Government assistance programs contribute to long-term unemployment is by providing an incentive, and the means, not to work. Each unemployed person has a 'reservation wage'—the minimum wage he or she insists on getting before accepting a job. Unemployment insurance and other social assistance programs increase that reservation wage, causing an unemployed person to remain unemployed longer."
ANSWER
"To fully understand unemployment, we must consider the causes of recorded long-term unemployment. Empirical evidence shows that two causes are welfare payments and unemployment insurance. These government assistance programs contribute to long-term unemployment."
"Government assistance increases the measure of unemployment by prompting people who are not working to claim that they are looking for work even when they are not. The work-registration requirement for welfare recipients, for example, compels people who otherwise would not be considered part of the labor force to register as if they were a part of it."
"Government assistance programs contribute to long-term unemployment is by providing an incentive, and the means, not to work. Each unemployed person has a 'reservation wage'—the minimum wage he or she insists on getting before accepting a job. Unemployment insurance and other social assistance programs increase that reservation wage, causing an unemployed person to remain unemployed longer."
ANSWER
Friday, April 16, 2010
Vancouver Real Estate Bubble
And, I thought that our sub-prime real estate debacle was bad. Wait until you see what a $1 million will buy in Vancouver.


Thursday, April 15, 2010
VAT Lessons from Europe
In today's (Thursday, April 15) "Opinion Page" of the Wall Street Journal is an excellent that explains the European experience with the "Value Added Tax (VAT)."
A VAT is essentially a national sales tax that is assessed at each stage of production, with the bill passed along to consumers at the cash register. In Europe the average rate is approximately 17.2%. (See the following table.) In the U.S., the VAT would undoubtedly be levied on top of federal, state and local sales taxes that range as high as 10%.

Selective excerpts of the article are as follows:
"One trait of European VATs is that while their rates often start low, they rarely stay that way. Of the 10 major OECD nations with VATs or national sales taxes, only Canada has lowered its rate. Denmark has gone to 25% from 9%, Germany to 19% from 10%, and Italy to 20% from 12%."
"The nonpartisan Tax Foundation recently calculated that to balance the U.S. federal budget with a VAT would require a rate of at least 18%."
"Proponents also argue that a VAT would result in less federal government borrowing. But that, too, has rarely been true in Europe."
"The very efficiency of the VAT means that it throws off huge amounts of revenue that politicians eagerly spend. The VAT thus becomes an engine of even greater public spending. In Europe, average government spending was about 30.2% of GDP when VATs began to spread in the late 1960s. Today, those governments are more than 50% larger, with spending of 47.1% of GDP on average. By contrast, U.S. government spending (federal and state) rose to 35.3% from 28.3% as a share of GDP in the same period."
"It is precisely this revenue-generating ability that makes the VAT so appealing to politicians. Even liberals understand that at some point high income tax rates stop yielding much more revenue as the rich change their behavior or exploit loopholes. The middle-class is where the real money is, and the only way to get more of it with the least political pain is through a broad-based consumption tax such as a VAT."
"In Europe, VAT has also meant lower levels of income growth and job creation. From 1982 to 2007, the U.S. created 45 million new jobs, compared to fewer than 10 million in Europe."
I believe the above facts speak for themselves. Once again, you have been forewarned.
A VAT is essentially a national sales tax that is assessed at each stage of production, with the bill passed along to consumers at the cash register. In Europe the average rate is approximately 17.2%. (See the following table.) In the U.S., the VAT would undoubtedly be levied on top of federal, state and local sales taxes that range as high as 10%.

Selective excerpts of the article are as follows:
"One trait of European VATs is that while their rates often start low, they rarely stay that way. Of the 10 major OECD nations with VATs or national sales taxes, only Canada has lowered its rate. Denmark has gone to 25% from 9%, Germany to 19% from 10%, and Italy to 20% from 12%."
"The nonpartisan Tax Foundation recently calculated that to balance the U.S. federal budget with a VAT would require a rate of at least 18%."
"Proponents also argue that a VAT would result in less federal government borrowing. But that, too, has rarely been true in Europe."
"The very efficiency of the VAT means that it throws off huge amounts of revenue that politicians eagerly spend. The VAT thus becomes an engine of even greater public spending. In Europe, average government spending was about 30.2% of GDP when VATs began to spread in the late 1960s. Today, those governments are more than 50% larger, with spending of 47.1% of GDP on average. By contrast, U.S. government spending (federal and state) rose to 35.3% from 28.3% as a share of GDP in the same period."
"It is precisely this revenue-generating ability that makes the VAT so appealing to politicians. Even liberals understand that at some point high income tax rates stop yielding much more revenue as the rich change their behavior or exploit loopholes. The middle-class is where the real money is, and the only way to get more of it with the least political pain is through a broad-based consumption tax such as a VAT."
"In Europe, VAT has also meant lower levels of income growth and job creation. From 1982 to 2007, the U.S. created 45 million new jobs, compared to fewer than 10 million in Europe."
I believe the above facts speak for themselves. Once again, you have been forewarned.
Monday, April 12, 2010
Why The Coming Wall Street Movie Really Does Portend Another Crash
Some things just never change. We will soon find out!


Saturday, April 10, 2010
Repo 105
Great video that explains how Lehman deceived the investment public through an accounting technique referred to as "Repo 105." For example, if Lehman owned a bond that was worth $105, it would sell it on the repo market for $100. (Technically, the seller of the repo agrees to purchase it back, say within day to a week.) The "105" in Repo refers to the fact the bond is worth at least 105% of what the seller (Lehman) was receiving for them. Since Lehman was only receiving $100 for $105 worth of collateral, Lehman could record it as a sell of securities and not a loan. However, for all practically purposes, it was a loan.
Why did Lehman institute Repo 105? By instituting Repo 105, it made its financial position look a whole lot better than what it really was. Let's assume that Lehman had assets of $105 and liabilities $100 and equity of $5. Therefore, Assets = Liabilities + Equity. Given these financial numbers, Lehman's "Equity Multiplier (Assets/Equity)" is 21x, which would indicate that Lehman is highly leveraged. Not good! Enter Repo 105. Lehman sells $50 worth of securities through the use of Repo 105. (Keep-in-mind that it does not have to record this financial transaction as a loan because of the Repo 105 rule.) It immediately takes the $50 and pays off $50 of its debt, which is reduced to $50. Now, the equity multiplier is only 5.5x, which is a drastic improvement from 21x. The equity multiplier of 5.5 is what gets reported to investors and everyone else. Once the reporting dates pass, Lehman has to reverse everything and the equity multiplier is back to 21x.
Lehman did not disclose its use of Repo 105 to the rating agencies, SEC, investors, or to its own Board of Directors. Doesn't anyone remember Enron, especially its auditors during this time?
I thought these types of accounting gimmicks ended with Enron. Where are the auditors? I know, everything was done within the standard framework of guidance promulgated by the GAAP. But, something is terribly wrong with such standard guidance.
Why did Lehman institute Repo 105? By instituting Repo 105, it made its financial position look a whole lot better than what it really was. Let's assume that Lehman had assets of $105 and liabilities $100 and equity of $5. Therefore, Assets = Liabilities + Equity. Given these financial numbers, Lehman's "Equity Multiplier (Assets/Equity)" is 21x, which would indicate that Lehman is highly leveraged. Not good! Enter Repo 105. Lehman sells $50 worth of securities through the use of Repo 105. (Keep-in-mind that it does not have to record this financial transaction as a loan because of the Repo 105 rule.) It immediately takes the $50 and pays off $50 of its debt, which is reduced to $50. Now, the equity multiplier is only 5.5x, which is a drastic improvement from 21x. The equity multiplier of 5.5 is what gets reported to investors and everyone else. Once the reporting dates pass, Lehman has to reverse everything and the equity multiplier is back to 21x.
Lehman did not disclose its use of Repo 105 to the rating agencies, SEC, investors, or to its own Board of Directors. Doesn't anyone remember Enron, especially its auditors during this time?
Repo 105 from Marketplace on Vimeo.
I thought these types of accounting gimmicks ended with Enron. Where are the auditors? I know, everything was done within the standard framework of guidance promulgated by the GAAP. But, something is terribly wrong with such standard guidance.
Friday, April 02, 2010
Weekly Update: Exponential Moving Average (EMA) Strategy for the S&P 500
 Note: To enlarge the chart, double-click inside of it.
What will the market do going forward? I don't know. I can give you a thousand reasons why this market can not go higher. However, I have learned one thing during my career following the stock market. That is, the market trend is your friend. And, that is why I am a trend follower. As long as the 15-week EMA > 40-week EMA, the trend is bullish (buy stocks). When the 15-week EMA < 40-week EMA, the trend is bearish (sell stocks). It really is that simple. It all comes down to the KISS concept.
Friday, March 26, 2010
Deleverage, Deflation, and the Federal Reserve
Thanks to "Contrary Investor," the following chart further confirms my believe that the deflation through deleveraging will continue throughout 2010. The long-term average from 1980 indicates an average "House Debt as a % of GDP" of 66.4%. Currently, that percentage is approximately 95%. Reversion to the mean, anyone? I, for one, do believe that the reversion will take place, which means that deleveraging still has a long way to go.

Now, what does this mean for Fed monetary policy for the remainder of 2010? Take a look at following table.

Over the last year, the FED has purchased approximately $1.25 trillion of U.S. Treasuries, Mortgage Back Securities (MBS), and Government Agency Securities out of thin air. What is interesting about the FED purchasing $1.25 trillion of "questionable, quality assets, is that the money supply (M2) hardly increased, something like less than $50 billion. What happened? Well, deleveraging occurred. See, when deleveraging occurs, the money supply decreases; because individuals are paying off their debts. When you pay off debt, you write a check; and the money supply decreases by the amount of the check. Or, when banks write off defaulted commercial and consumer loans, money supply also declines. That is why inflation has not been a real problem because of deleveraging. The deflationary factors of deleveraging have exerted a greater influence that the FED's inflationary forces of injecting $1.25 trillion into the economy.
I firmly believe that the FED will provide another mega dose of liquidity into the economy as it tries to reflate the economy this year. The last thing that the FED wants to occur is an outright decrease in the money supply. As long as the FED provides liquidity in its attempt to stem the tide of those deflationary forces, financial assets, especially the stock market, should benefit directly as it did in 2009. The reason being is the liquidity has to go somewhere, because banks are not making loans.

Now, what does this mean for Fed monetary policy for the remainder of 2010? Take a look at following table.

Over the last year, the FED has purchased approximately $1.25 trillion of U.S. Treasuries, Mortgage Back Securities (MBS), and Government Agency Securities out of thin air. What is interesting about the FED purchasing $1.25 trillion of "questionable, quality assets, is that the money supply (M2) hardly increased, something like less than $50 billion. What happened? Well, deleveraging occurred. See, when deleveraging occurs, the money supply decreases; because individuals are paying off their debts. When you pay off debt, you write a check; and the money supply decreases by the amount of the check. Or, when banks write off defaulted commercial and consumer loans, money supply also declines. That is why inflation has not been a real problem because of deleveraging. The deflationary factors of deleveraging have exerted a greater influence that the FED's inflationary forces of injecting $1.25 trillion into the economy.
I firmly believe that the FED will provide another mega dose of liquidity into the economy as it tries to reflate the economy this year. The last thing that the FED wants to occur is an outright decrease in the money supply. As long as the FED provides liquidity in its attempt to stem the tide of those deflationary forces, financial assets, especially the stock market, should benefit directly as it did in 2009. The reason being is the liquidity has to go somewhere, because banks are not making loans.
Thursday, March 25, 2010
Bubbles, Bubbles, and More Bubbles
 Source: Market Ticker. Note: To enlarge the chart, double-click inside of it.
All financial bubbles, such as the dot.com bubble of 2000, real estate bubble of 2007, and the current stock market bubble, are in fact credit bubbles at their core. That is just another way of saying induced by credit expansion by the Federal Reserve System, which is what the above chart depicts. And, that is exactly what the Fed has done since 2008 in its attempt to re-inflate the bubble. Notice the parabolic rise in debt, which can not be sustained. Something has to give, and it will not be pretty. History tells us that all credit-induced bubbles fail. This time will be no different.
Ok, what is an equity investor suppose to do in such a bubble environment? My recommendation is to follow my exponential moving average strategy. See my post from Monday, March 22, 2010, entitled, "S&P 500 Weekly Update."
Unions Want to Take Over Your 401(k)
Gene J. Koprowski over at MoneyNews.Com reports the following news item: "One of the nation's largest labor unions, the Service Employees International Union (SEIU), is promoting a plan that will centralize all retirement plans for American workers, including private 401(k) plans, under one new "retirement system" for the United States. In effect, government pensions for everyone, not unlike the European system and regardless of personal choice."
Perfectly logical to me. Isn't it? We now have national health-care insurance. Why not nationalize all defined-benefit plans (pensions) and defined-contribution plans. What's next? Nationalized religion? I think we have that, and it is referred to as the Federal Government.
Perfectly logical to me. Isn't it? We now have national health-care insurance. Why not nationalize all defined-benefit plans (pensions) and defined-contribution plans. What's next? Nationalized religion? I think we have that, and it is referred to as the Federal Government.
Wednesday, March 24, 2010


Monday, March 22, 2010

20 Promises for $2,500: All Americans Now Await Lower Premiums Promised by Obama
Breitbart.tv » 20 Promises for $2,500: All Americans Now Await Lower Premiums Promised by Obama
Let me know when you get your $2,500 premium reduction. I am in the process of making a list on a "Post-it Note" of everyone that receives this premium reduction.
Let me know when you get your $2,500 premium reduction. I am in the process of making a list on a "Post-it Note" of everyone that receives this premium reduction.
U.S. Treasury Pays More Than Buffett as U.S. Risks AAA Rating Status
Two-year notes sold by the billionaire’s Berkshire Hathaway Inc. in February yielded "3.5 basis points" less than Treasuries of similar maturity, according to data compiled by Bloomberg. Procter & Gamble Co., Johnson & Johnson and Lowe’s Co. debt also traded at lower yields in recent weeks, a situation former Lehman Brothers Holdings Inc. chief fixed-income strategist Jack Malvey calls an “exceedingly rare” event in the history of the bond market.
This is a major concern that has not drawn a lot of attention in the main-stream media. I can not remember a time when interest rates on private debt was ever lower than on Treasury debt. This is extremely alarming! The bond market is saying that, in terms of credit risk, some private companies are safer that the U.S. Government. Why? Because our government continues its way of deficit spending, especially with this "new" health bill.
This is a major concern that has not drawn a lot of attention in the main-stream media. I can not remember a time when interest rates on private debt was ever lower than on Treasury debt. This is extremely alarming! The bond market is saying that, in terms of credit risk, some private companies are safer that the U.S. Government. Why? Because our government continues its way of deficit spending, especially with this "new" health bill.
Thursday, March 11, 2010
From Bad to Worst and Nobody Seems to Care
Last month the U.S. posted a record $220.9 billion budget deficit. We took in $107 billion but spent $328 billion. That means we only funded 32% of all federal government expenditures. Of the $328 billion that was spent, $164 billion went for entitlements. You know, like Social Security, Medicare, Medicaid, etc. Now, this is the scary part. If we eliminate the $164 billion of entitlements, which leaves us with $164 billion for other expenditures, we still don't have enough revenue to pay for it. Because we only took in $107 billion. Folks, this can not and will not continue that much longer. We can not continue to spend our way to prosperity without the revenue to match it. I know there are those out there, especially in Washington, that believe that as long as we have checks, it must be ok to use them.
Given the theme of this post, I believe it is a good time to revisit the U.S. Debt Clock.
Given the theme of this post, I believe it is a good time to revisit the U.S. Debt Clock.
Thursday, March 04, 2010
Productivity Up Sharply, Labor Costs Drop in Fourth Quarter 2009
What is the true meaning to the title? Answer: (1) Work harder and get more done. (2) Get paid less. and (3) Suck it up, don't complain, or you're fired. Oh, reduced labor cost (reduced pay per unit of work) simply means "deflation."
Thursday, February 18, 2010
FXP (Ultra-short China ETF)

Bottom Line: I like the Risk/Reward Ratio (Risk $1 to Make $11).
Note: FXP sold for $200 back in October 2008. I am not suggesting that this price level will be seen anytime soon, but I do like its potential to trade at $15 from the current $9.
2011 Federal Budget: Office of Management and Budget
 Note: To enlarge the charts, double-click inside of it.
Items of Interest:
1. The projected deficit for 2011 (October 2010 to September 2011) is projected to be $1,200,000,000,000. That is $1.2 trillion of the red stuff! How many years can this nation run "DEFICITS" in the trillions? See the "Debt Clock."
2.Medicare/Medicaid and Security payments to Total Federal Receipts is 84%. What does that mean? For every dollar that the federal government takes in, 84 cents goes to pay medicare/medicaid and social security recipients. Wow! That leaves 16 cents to pay for everything else, such as defense, non-defense, interest, etc.
Monday, February 08, 2010

Saturday, February 06, 2010
Secret Summit of Top Bankers
Did you know about this secret meeting that is taking place in Australia? I have not read about it in the "Wall Street Journal," which is usually on top things. The meeting is on, and no one is reporting on it.
Representatives from 24 central banks and monetary authorities including the U.S. Federal Reserve and European Central Bank landed in Sydney to meet tomorrow at a secret location. Why the secret meeting and secret location? This is a little resemblance of 2007-08, which does not make me feel too comfortable.
Representatives from 24 central banks and monetary authorities including the U.S. Federal Reserve and European Central Bank landed in Sydney to meet tomorrow at a secret location. Why the secret meeting and secret location? This is a little resemblance of 2007-08, which does not make me feel too comfortable.
Wednesday, February 03, 2010
Are You Rich?
McHugh's Market Update states it this way: "We learned yesterday that the government has proposed a $3.8 trillion budget for 2011, with $2.0 trillion of tax increases, $1.0 trillion coming by increasing income taxes on families who earn more than $250,000. (Yet, with those tax increases, the federal deficit is projected at $1.3 trillion, which maybe on the low side.) For those of you earning $250,000 in your families, which would equate approximately to an Adjusted Gross Income (AGI) of $125,000, I ask you the question, are you rich? You are paying $1,200 a month in health insurance, paying $40,000 a year in college tuition with no scholarship help because you make too much money, and had 40 percent of your stock investments and 20 percent of your real estate investments wiped out the past three years. You pay three times as much in real estate taxes on the same home you lived in ten years ago. Are you rich? You work for a firm that could downsize or go bankrupt at any moment. Are you rich?"
By the way, those with AGI of at least $125,000 already pay close to 75% of all Federal personal income taxes. Talking about killing the "Goose That Laid the Golden Eggs." Good job government, you have finally done it.
What is our lesson learned? Well, if you make less than $250,000, do not aspire to make more money, because you too will be targeted as rich. You too will get taxed back to a take-home level where the government believes you should be. So be satisfied with less, or else!
We as a nation have forgotten that a market economy works best when households are the engine of economic growth, not large money center banks or government. Taxes need to be reduced and rebated in a big way across the board to all households and small businesses. That (IMHO) is the correct policy that will return prosperity to America, will create real jobs in the private sector, not the government sector (By the way, the government reported that this year we will have the largest federal work force in modern history at 2.15 million!), high paying jobs, real economic growth, stability to financial markets. Kennedy did it. Reagan did it. Come on Obama, you can do it!
By the way, those with AGI of at least $125,000 already pay close to 75% of all Federal personal income taxes. Talking about killing the "Goose That Laid the Golden Eggs." Good job government, you have finally done it.
What is our lesson learned? Well, if you make less than $250,000, do not aspire to make more money, because you too will be targeted as rich. You too will get taxed back to a take-home level where the government believes you should be. So be satisfied with less, or else!
We as a nation have forgotten that a market economy works best when households are the engine of economic growth, not large money center banks or government. Taxes need to be reduced and rebated in a big way across the board to all households and small businesses. That (IMHO) is the correct policy that will return prosperity to America, will create real jobs in the private sector, not the government sector (By the way, the government reported that this year we will have the largest federal work force in modern history at 2.15 million!), high paying jobs, real economic growth, stability to financial markets. Kennedy did it. Reagan did it. Come on Obama, you can do it!
Friday, January 29, 2010
GDP Expands at 5.7% Rate in Fourth Quarter of 2009
The U.S. economy increased at a bigger-than-expected gain, which was driven more by slower inventory liquidation than by consumer spending. As a matter of fact, the slower fourth-quarter inventory drawdown added 3.39% to GDP. (Folks, it is about statistics. If you go from 2 to 1, that is a 50% decline; however, if you go from 1 to 2, that is a 100% increase. That is exactly what is happening to these inventory numbers. Businesses can only allow inventory to go so low. So what we are seeing here is that businesses have reached the point where the drawdown has now reached a level where a smaller percentage decline is really an increase. Like I said, it is all about the statistics!)
As mentioned, inventory drawdown added 3.9% to GDP; while consumer spending contributed about 1.5%. Consumer spending expanded at a very moderate rate but definitely remains constrained by a very weak labor market (It's all about jobs, stupid.) and household deleveraging. When you have close to 70% of GDP growth accounted for by inventory drawdown, that is not a real strong endorsement for economic health. And, keep-in-mind that these GDP statistics will be revised twice over the next two months. Right down, I would say those revisions will be adjusted downward, as the numbers were for the third quarter of 2009.
As mentioned, inventory drawdown added 3.9% to GDP; while consumer spending contributed about 1.5%. Consumer spending expanded at a very moderate rate but definitely remains constrained by a very weak labor market (It's all about jobs, stupid.) and household deleveraging. When you have close to 70% of GDP growth accounted for by inventory drawdown, that is not a real strong endorsement for economic health. And, keep-in-mind that these GDP statistics will be revised twice over the next two months. Right down, I would say those revisions will be adjusted downward, as the numbers were for the third quarter of 2009.
Thursday, January 28, 2010
Money Market Funds: No Longer Guaranteed Liquid
Folks, this is down-right scary; and it is something that is not mentioned much in the media, unless you do your research.
According to the Securities Law Professor Blog, "Suspension of Redemptions: The new rules permit a money market fund's board of directors to suspend redemptions if the fund is about to break the buck and decides to liquidate the fund (currently the board must request an order from the SEC to suspend redemptions). In the event of a threatened run on the fund, this allows for an orderly liquidation of the portfolio. The fund is now required to notify the Commission prior to relying on this rule."
Formerly the fund had to seek permission to suspend redemptions. Now, the fund's board is empowered to do so unilaterally and advise the SEC after the fact.
This is potential a major problem to money market investors. As a money market investor, you could easily find yourself unable to get to your money until the fund liquidates. You have been forewarned.
According to the Securities Law Professor Blog, "Suspension of Redemptions: The new rules permit a money market fund's board of directors to suspend redemptions if the fund is about to break the buck and decides to liquidate the fund (currently the board must request an order from the SEC to suspend redemptions). In the event of a threatened run on the fund, this allows for an orderly liquidation of the portfolio. The fund is now required to notify the Commission prior to relying on this rule."
Formerly the fund had to seek permission to suspend redemptions. Now, the fund's board is empowered to do so unilaterally and advise the SEC after the fact.
This is potential a major problem to money market investors. As a money market investor, you could easily find yourself unable to get to your money until the fund liquidates. You have been forewarned.
Wednesday, January 27, 2010
Apple

To stay the least, I love the Apple toys, iPhone, MacBook, iPod. As a matter of fact, I want to have anything that has Apple produces. Now, we will have the iTablet, which will be unveiled to the world to see at 1 PM (EST). There is an old Wall Street adage that goes like this: "Buy the Rumor and Sell the News."
AAPL has had a great price run since March 2009, going from $78 to over $200. But, IMHO, I think the party is over. The following chart depicts the various cyclical phases for AAPL, just like GS. The stock has definitely been going through distribution, and it appears that the distribution phase could conclude today with the unveiling of the iTablet. The next phase, declining, could take us back to the mid-$80s. Sorry Apple, but I still love your products.
 Note: To enlarge, double-click inside of it.
Tuesday, January 26, 2010
Goldman Sachs (GS): Distribution Phase
Goldman Sachs (GS) has culminated its distribution phase at $160 and started its declining phase that could take it back to $88. All stocks generally go through a typical stock cycle. That is, accumulation phase, advancing phase, distribution phase, and declining phase. Take a look at the following chart of GS and see how well-defined the phases of accumulation, advancing, and distribution were since March 2009.
 Note: To enlarge the chart, double-click inside of it.
What does this all mean? Well, stay completely clear of GS! I have placed FAZ on my radar. FAZ is the financial bear ETF. It moves inversely to financial stocks. In the case of FAZ, it carries leverage of 3X. That is, if financial stocks decline by 10%, FAZ should appreciate by 30%. Likewise, if financial appreciate, FAZ declines by a factor of 3. Stay tuned!
 Note: To enlarge the chart, double-click inside of it.
What does this all mean? Well, stay completely clear of GS! I have placed FAZ on my radar. FAZ is the financial bear ETF. It moves inversely to financial stocks. In the case of FAZ, it carries leverage of 3X. That is, if financial stocks decline by 10%, FAZ should appreciate by 30%. Likewise, if financial appreciate, FAZ declines by a factor of 3. Stay tuned!
Sunday, January 24, 2010
S&P 500 Weekly Update for January 22, 2010
Bad week for the Bulls, good week for the Bears. Is this the start of the decline that the bears have been waiting for since March 2009? I don't know. I will simply listen to the market to tell me by way of the exponential moving averages.
 Note: To enlarge chart, double-click inside of chart.
 Note: To enlarge chart, double-click inside of chart.
Saturday, January 16, 2010
S&P 500 Weekly Update for January 15, 2010
Reflecting on the 2009 investment strategy utilizing the exponential moving averages, I became fully invested on Monday, September 21, 2009. On that date, I allocated the final 25% to the purchase of SPY (ETF on the S&P 500). My overall cost basis is $104.24. Given Friday's close for SPY at $113.64, the investment account is up 9.01%. On an annualized basis, the investment account is up 28.1%.
What will the market do going forward? I don't know. I can give you a thousand reasons why this market can not go higher. However, I have learned one thing during my career following the stock market. That is, the market trend is your friend. And, that is why I am a trend follower. As long as the 15-week EMA > 40-week EMA, the trend is bullish (buy stocks). When the 15-week EMA < 40-week EMA, the trend is bearish (sell stocks). It really is that simple. It all comes down to the KISS concept.
This week's update is as follows:
 Note: To enlarge the chart, double-click inside of it.
What will the market do going forward? I don't know. I can give you a thousand reasons why this market can not go higher. However, I have learned one thing during my career following the stock market. That is, the market trend is your friend. And, that is why I am a trend follower. As long as the 15-week EMA > 40-week EMA, the trend is bullish (buy stocks). When the 15-week EMA < 40-week EMA, the trend is bearish (sell stocks). It really is that simple. It all comes down to the KISS concept.
This week's update is as follows:
 Note: To enlarge the chart, double-click inside of it.
Thursday, January 14, 2010
Haiti
We may never learn the precise death toll inflicted by Tuesday evening's earthquake in Haiti. However, it's clear that it may rank with the 2004 Christmas tsunami. That is, 50,000 or even more people may be dead.
This is a nation where life expectancy is 53 and the average per-capita income barely eclipses $1/day. Haiti is the poorest of the poorest countries. These people need help. Please be cautious about what organization you decide to provide that assistance but do give whatever you can. There are many "relief organizations" that waste huge amounts of money, and then there are those that manage to provide nearly all of what you give to the people impacted.
One organization that I like is Convoy of Hope out of Springfield, MO. Check them out. If you can not provide financial assistance, please pray for the victims of the earthquake, especially those who are still searching through the rubble looking for lost loved ones.
This is a nation where life expectancy is 53 and the average per-capita income barely eclipses $1/day. Haiti is the poorest of the poorest countries. These people need help. Please be cautious about what organization you decide to provide that assistance but do give whatever you can. There are many "relief organizations" that waste huge amounts of money, and then there are those that manage to provide nearly all of what you give to the people impacted.
One organization that I like is Convoy of Hope out of Springfield, MO. Check them out. If you can not provide financial assistance, please pray for the victims of the earthquake, especially those who are still searching through the rubble looking for lost loved ones.
Wednesday, January 13, 2010
Move Your Money
I thought the title would get your attention. In all seriousness, check out the "Move Your Money" site to find a bank and/or credit union near you. Why? If you are fed up with all the lies coming forth from those "too big to fail banks," such as Bank of America and Citigroup, then it's time for us to organize mass-removals of funds from these "too big to fail" banks to "local banks and/or credit unions. So, please check out the site.
The Geithner AIG Story
According to the "Wall Street Journal," House Oversight Chairman Edolphus Towns, a Democrat who represents the 10th District of New York, has asked Treasury Secretary Geithner to testify next week about the taxpayer bailout of $187 billion to AIG. This is a good start in determining why the Fed of New York urged AIG to limit disclosure of its deal to buy out derivative (credit default swaps) trading partners (Goldman Sachs) at 100 cents on the dollar.
But, what is really more disturbing is that Geithner would be the individual who would chair a new Financial Services Oversight Council, under the House regulatory reform package. The council could declare virtually any company in America a systemic risk, making them eligible for intervention on the taxpayer's dime. "The law firm Davis Polk reports that since this council is not an agency, it will not be subject to the Administrative Procedure Act, the Freedom of Information Act or the Sunshine Act, among other laws intended to allow citizens to scrutinize government." That is not a good idea!
But, what is really more disturbing is that Geithner would be the individual who would chair a new Financial Services Oversight Council, under the House regulatory reform package. The council could declare virtually any company in America a systemic risk, making them eligible for intervention on the taxpayer's dime. "The law firm Davis Polk reports that since this council is not an agency, it will not be subject to the Administrative Procedure Act, the Freedom of Information Act or the Sunshine Act, among other laws intended to allow citizens to scrutinize government." That is not a good idea!
Saturday, January 09, 2010
AIG – Geithner Cover Up: The Smoking Gun
An article over on Seeking Alpha makes the following assertion via documentary evidence this is Geithner's own handwriting:

If this is Geithner's handwriting on the page. He is going to jail! Why is he going to jail? Specifically, Sarbanes-Oxley added the following to US Code Title 18, Part 1, Chapter 73, S.1519: "Whoever knowingly alters, destroys, mutilates, conceals, covers up, falsifies, or makes a false entry in any record, document, or tangible object with the intent to impede, obstruct, or influence the investigation or proper administration of any matter within the jurisdiction of any department or agency of the United States or any case filed under title 11, or in relation to or contemplation of any such matter or case, shall be fined under this title, imprisoned not more than 20 years, or both."
Maybe Geithner and Madoff will be sharing the same cell. Would not that be interesting? While we are at it, I would like to know how much "Bennie Boy" knew about this cover-up. Also, let's see what Henry Paulson knew, former U.S. Treasury Secretary (Bush Administration) and past Chairman and CEO of Goldman Sachs. Just maybe we could have a "foursome" sharing the cell at the Graybar Hotel.

If this is Geithner's handwriting on the page. He is going to jail! Why is he going to jail? Specifically, Sarbanes-Oxley added the following to US Code Title 18, Part 1, Chapter 73, S.1519: "Whoever knowingly alters, destroys, mutilates, conceals, covers up, falsifies, or makes a false entry in any record, document, or tangible object with the intent to impede, obstruct, or influence the investigation or proper administration of any matter within the jurisdiction of any department or agency of the United States or any case filed under title 11, or in relation to or contemplation of any such matter or case, shall be fined under this title, imprisoned not more than 20 years, or both."
Maybe Geithner and Madoff will be sharing the same cell. Would not that be interesting? While we are at it, I would like to know how much "Bennie Boy" knew about this cover-up. Also, let's see what Henry Paulson knew, former U.S. Treasury Secretary (Bush Administration) and past Chairman and CEO of Goldman Sachs. Just maybe we could have a "foursome" sharing the cell at the Graybar Hotel.
Friday, January 08, 2010

UPS Plans to Cut 1,800 Jobs
"UPS said it would cut 1,800 staff in the U.S., with a one-time charge offset by savings in its domestic small-package unit. The Atlanta-based company said the cuts were part of a long-planned management restructuring, rather than a reaction to the slow economy. It trimmed about 13,000 U.S. jobs last year, mostly through attrition, in response to the recession and a steep downturn in package volume."
Nice spin UPS. Yet another company trying to boost earnings through cost containment measures of cutting labor cost. I have been saying for some time that it's all about jobs. You can not grow the economy (GDP) without creating jobs. Period. No jobs, no income. No income results in no consumption and a negative drag on GDP. It really is that simple.
Nice spin UPS. Yet another company trying to boost earnings through cost containment measures of cutting labor cost. I have been saying for some time that it's all about jobs. You can not grow the economy (GDP) without creating jobs. Period. No jobs, no income. No income results in no consumption and a negative drag on GDP. It really is that simple.
Geithner Cover-up Gains Momentum
In yesterday's post, I discussed the cover-up at the Fed of New York under the guidance at the time of Geithner between AIG and Goldman Sachs. I am glad to read that something may come from this revelation.


Thursday, January 07, 2010
Geithner’s New York Fed Told AIG to Limit Swaps Disclosure
Bloomberg reports today that "The Federal Reserve Bank of New York, then led by Timothy Geithner, told AIG to withhold details from the public about the bailed-out insurer’s payments to banks during the depths of the financial crisis, e-mails between the company and its regulator show. AIG said in a draft of a regulatory filing that the insurer paid banks, which included Goldman Sachs Group Inc. and Societe Generale SA, 100 cents on the dollar for credit-default swaps they bought from the firm. The New York Fed crossed out the reference, according to the e-mails, and AIG excluded the language when the filing was made public on Dec. 24, 2008. The e-mails were obtained by Representative Darrell Issa, ranking member of the House Oversight and Government Reform Committee."
Remember, this was when Geithner was the head of the NY Fed. Who was he trying to protect? American taxpayers? No! AIG shareholders? No! Oh, I see. It was Goldman Sachs. He intentionally crossed off the reference to Goldman Sachs who received 100% on the dollar of the credit default swaps they had with AIG. I suppose this is the sort of thing we should have expected from an admitted tax cheat.
I will be very succinct with what President Obama should do with this information -- fire Treasury Secretary Geithner! Why? Geithner had an ethical responsibility to the American taxpayer and AIG shareholders to do so, not to cover such information up.
Remember, this was when Geithner was the head of the NY Fed. Who was he trying to protect? American taxpayers? No! AIG shareholders? No! Oh, I see. It was Goldman Sachs. He intentionally crossed off the reference to Goldman Sachs who received 100% on the dollar of the credit default swaps they had with AIG. I suppose this is the sort of thing we should have expected from an admitted tax cheat.
I will be very succinct with what President Obama should do with this information -- fire Treasury Secretary Geithner! Why? Geithner had an ethical responsibility to the American taxpayer and AIG shareholders to do so, not to cover such information up.
Tuesday, January 05, 2010
Home Affordable Foreclosure Alternatives Program (HAFA)
Does anyone remember Home Affordable Modification Program (HAMP)? I didn't think so. HAMP is the government, more specifically Treasury, program to prevent foreclosures. There are approximately 750,000 homes under HAMP, which 30,000 have converted to permanent changes in P&I, or 4%. That immediately tells me that the other 96% do not qualify under the new, so-called lenient guidelines, because these mortgagees don't have the income to qualify and/or they have significant negative equity in their homes.
So, what does they have to do with HAFA? First, HAFA is a supplemental directive pertaining to HAMP that was promulgated in November 2009 for the some 70 Servicers participating in HAMP. (For a list of these Servicers, click on HAMP Servicers.) Second, for those mortgagees who cannot qualify for a permanent mortgage modification while on a trial program (96%), Servicers "are" required to offer "short sale or deed in lieu" alternatives. HARP goes into effect in April 1, 2010. Keep-in-mind that HAMP servicers must offer procedures to mortgagees for short sales or deed in lieu. That is the law!
Now, come the traditional spring selling season for homes, we are going to see a flood of homes that were in HAMP but failed for permanent changes for whatever reason hit the real estate market. Remember that 96% and basic supply and demand from economics. A flood of close to 3/4 of a million homes have the potential to hit the market. Folks, that is just the HAMP program, not counting the inventory of homes being held in foreclosure at our financial institutions. If you need to sell your home within the next year, take heed. That is, get that thing sold within the next six months. If you are planning on buying a home, I would recommend you wait until the smoke clears (late summer of 2010). I know some of you are saying what about that $8,000 first-time home buyers tax credit. Let me say this about that! That $8,000 tax credit may be the most expensive money you have ever received compared to the housing deal that you would obtain had you waited several months and purchased into the supply of "short sales and deed in lieu" homes. The choice is yours. You have been forewarned.
So, what does they have to do with HAFA? First, HAFA is a supplemental directive pertaining to HAMP that was promulgated in November 2009 for the some 70 Servicers participating in HAMP. (For a list of these Servicers, click on HAMP Servicers.) Second, for those mortgagees who cannot qualify for a permanent mortgage modification while on a trial program (96%), Servicers "are" required to offer "short sale or deed in lieu" alternatives. HARP goes into effect in April 1, 2010. Keep-in-mind that HAMP servicers must offer procedures to mortgagees for short sales or deed in lieu. That is the law!
Now, come the traditional spring selling season for homes, we are going to see a flood of homes that were in HAMP but failed for permanent changes for whatever reason hit the real estate market. Remember that 96% and basic supply and demand from economics. A flood of close to 3/4 of a million homes have the potential to hit the market. Folks, that is just the HAMP program, not counting the inventory of homes being held in foreclosure at our financial institutions. If you need to sell your home within the next year, take heed. That is, get that thing sold within the next six months. If you are planning on buying a home, I would recommend you wait until the smoke clears (late summer of 2010). I know some of you are saying what about that $8,000 first-time home buyers tax credit. Let me say this about that! That $8,000 tax credit may be the most expensive money you have ever received compared to the housing deal that you would obtain had you waited several months and purchased into the supply of "short sales and deed in lieu" homes. The choice is yours. You have been forewarned.
Sunday, January 03, 2010
Bernanke in Denial 2005-2007
This is the man that was so wrong before and will be proven so wrong again! Please listen very closely to what he stated during 2005-07, and then ask yourself if you have any confidence or faith in anything that he says currently.
Subscribe to:
Posts (Atom)