Wednesday, January 30, 2013
Friday, January 25, 2013


What Did $3 Trillion Get the Economy Since 2009?
Well, the Fed has been very productive in pouring trillions of dollars into the economy. And, who has really benefited from such a massive scale of liquidity? Well, it has not been Main Street. Simply look at the following chart and you will quickly notice that since 2009, non-farm payrolls (job creation) and real the growth of GDP (income levels) have significantly lacked behind the growth in food-stamp participants and the stock market. Now, who has benefited from the Fed's outpouring of printed cash? Of course, it is Wall Street. But, then again, the answer should not surprise anyone, because the Fed and Wall Street are really one in the same.


Thursday, January 24, 2013
Federal Reserve's Holdings of U.S. Gov't Debt Hits Record $1,696,691,000,000
Today, the Federal Reserve revealed that its holdings of U.S. government
securities (debt) had increased to an all-time record of $1,696,691,000,000. (Yes, that is in trillions.) This makes the Fed the single largest holder of U.S. government debt. China comes in second at $1,170,100,000,000.
And, I thought the Federal Reserve System was not suppose to monetize the debt of our government. I guess that I am just too naive and simply not with this whole "Quantitative Easing (QE) thing by the Fed. In other words, what's all this worry about the debt ceiling when you have the Federal Reserve System that can simply create money out of "nothing" to purchase Treasury securities. What's the problem? The Fed is the enlightened one. It knows exactly what it is doing. Sit back and simply watch as the enlightened Fed utterly debases the U.S. currency through its monetary policies. You know like keeping the dollar stable in value, which is one of its mandated goals. Let's see how well that has worked. The Fed was created by commercial banks in 1913, not by the federal government. Therefore, if you had $1 in 1913, the value of that $1 today would be worth "FOUR CENTS!" To put it another way, that $1 in 1913 has lost 96% of its value in terms of purchasing power.
And, I thought the Federal Reserve System was not suppose to monetize the debt of our government. I guess that I am just too naive and simply not with this whole "Quantitative Easing (QE) thing by the Fed. In other words, what's all this worry about the debt ceiling when you have the Federal Reserve System that can simply create money out of "nothing" to purchase Treasury securities. What's the problem? The Fed is the enlightened one. It knows exactly what it is doing. Sit back and simply watch as the enlightened Fed utterly debases the U.S. currency through its monetary policies. You know like keeping the dollar stable in value, which is one of its mandated goals. Let's see how well that has worked. The Fed was created by commercial banks in 1913, not by the federal government. Therefore, if you had $1 in 1913, the value of that $1 today would be worth "FOUR CENTS!" To put it another way, that $1 in 1913 has lost 96% of its value in terms of purchasing power.
The Truth about "AK and AR" Firepower
I fully understand that this blog is not about
guns, nor “Gun Control.” And, I don’t
want it to be. However, a lot of
misinformation is out there concerning the firepower of “AKs and ARs.” See, it is
all about the “cartridge size” of the bullet, not the type of gun (AK or
AR). In other words, it is pure politics
of misinformation as it pertains to these types of guns. Once you review the video, you may just agree
with me.
Wednesday, January 23, 2013
What, Me Worry?
Investors are not worried at all. Why? Because investors believe they have a "put" from the Federal Reserve System. In that any
precipitous
drop in the market, the Fed will "bail-out" any and all investors that are long equities. And, why would investors believe the "put" theory? Simply look at how the Fed has manipulated the equity markets since March of 2009. Enough said.
Ok, how does one measure this market complicity? It is measured through various volatility indices that measure the implied volatility for a basket of put and call options related to a specific index, such as the DJIA ($VXD), S&P 500 (VXV), and NASDAQ ($VXN). When these volatility indices reach extremely low levels, investors perceive little investment risk going forward, which is usually a very good harbinger that the market is ready for a major correction. As a matter of fact, today's levels of volatility are the lowest since 2007.
The following volatility chart of the S&P 500 ($VXV) indicates how investors perceive a total lack of concern to a significant decline in the market. I have learned one thing in following the market over the past couple of decades is that the "market will do whatever it takes to prove the majority of investors wrong!"

Union Membership
The Bureau of Labor and Statistics (BLS) reported today that in 2012 union membership rate, which is the percent of wage and salary workers who were members of a union, was 11.3 percent, down from 11.8 percent in 2011. The number of wage and salary workers belonging to unions, at 14.4 million, also declined over the year. For a perspective on this decline, the BLS states the following: "In 1983, the first year for which comparable union data are available, the union membership rate was 20.1 percent, and there were 17.7 million union workers.
Highlights of the report are given as follows:
Highlights of the report are given as follows:
- Public-sector workers had a union membership rate (35.9%) more than five times higher than that of private-sector workers (6.6%).
- Workers in education, training, and library occupations and in protective service occupations had the highest unionization rates, at 35.4% and 34.8%, respectively.
- Black workers were more likely to be union members than were white, Asian, or Hispanic workers.
- Among states, New York continued to have the highest union membership rate (23.2%), and North Carolina again had the lowest rate (2.9%).
Monday, January 21, 2013
How Did the American Revolution Really Start? Gun Control or Taxation?

"Our American Revolution did not start over "taxation," which many probably believe to be true. Yes, taxation was an issue. However, the fact remains that the actual cause of armed hostilities in 1775 was an attempt to confiscate military-style weapons from the citizens." Thanks "Market-Ticker" for setting the record straight.
Saturday, January 19, 2013
Debt Ceiling Shenanigans
Selective Economic Questions:
- What is the current size of our national debt? Answer: $16.461 trillion.
- What is the current size of our GDP? Answer: $15.555 trillion. [Our national debt is approximately 106% of GDP!]
- How many times since 2001 has the debt ceiling been raised? Answer: Eleven.
- Have we breached the current debt ceiling limit? Answer: Yes. [We have exceeded it by $41.3 billion.]
- How can the government exceed the debt ceiling? Answer: The government has been able to circumvent the debt ceiling by raiding its various trust funds. However, these trust funds will run out of money by the end of March.
- What is the House Republicans' strategy for dealing with the debt crisis going forward? Answer: Kick the "proverbial debt can" down the road for another three months.
- What was the approximate "federal deficit" for 2012? Answer: $1.3 trillion.
- When one takes into account the 2012 "federal deficit" plus the "present value of our unfunded liabilities, such as Social Security & Medicare, for 2012, what was the TRUE federal deficit for 2012? Answer: $6.9 trillion.
- What would you like to say to Congress? Answer: I am sorry, but I can not print that!
Thursday, January 17, 2013
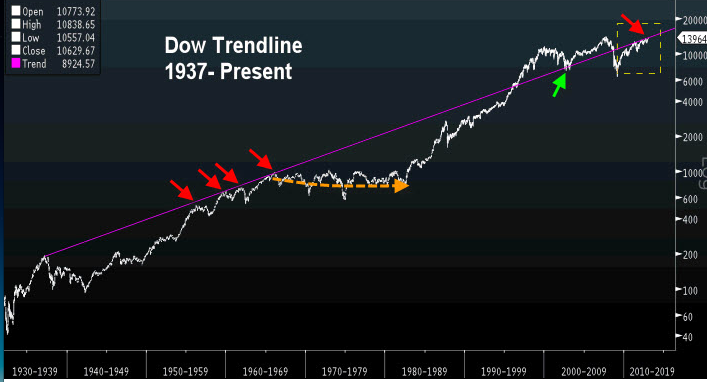
The 80-year S&P 500 Log Chart Trendline: Mean Reversion
I extracted the following chart from Zero Hedge. The bottom line conclusion from the chart is the following statement: "For over 80 years, the S&P 500 has cyclically reverted to it its logarithmic trend-line growth. The last time the market reverted from its bullish up-trend was in 1982 (and the previous period of cyclical reversion took 32 years from 1942 to 1974) and suggests the S&P 500 could well revert to around an 850 level within the next year or so."


Tuesday, January 15, 2013
Economic/Financial Bubbles Never End Well!
Education is indeed the new bubble, and as is true with all pass bubbles will not end well for those that have taken on student loans and, of course, those that still pay taxes.

The following "for-profit-educational institutions" should be watched carefully for further clues as to when this bubble does burst: American Public Education (APEI), Apollo Group (APOL), DeVry (DV) and ITT Education (ESI). In other words, as an investor, I would avoid these stocks like the plague.
World Governments Gold Reserves

In today's world, we have two sets of
"Golden Rules.” We have the secular
“Golden Rule,” that states, “He who has the gold makes the rules;” and the
spiritual “Golden Rule,” that states, “Do to others what you
would have them do to you (Matthew 7:12).”
For my preference, I like the latter “Golden Rule.” However, my post today is about who has the
physical gold. And, as you will read
shortly, the United States has the vast majority of the world’s gold reserves,
which is why we are “still” the dominate power in the world and why our
currency “still” remains the world’s reserve asset. (Personally, I would like an audit of our gold
holdings.) As a matter of fact, the
reported figures indicate that the U.S. has something like 2.4 times as much
gold as the second largest holder, which is Germany. (Definitely keep an eye on Germany’s
influence on world events. The world’s
focus is on China’s influence throughout the world. I contend Germany is where we should be
focusing on, especially in the Middle East.)
- United States (8,133.3 tons)
- Germany (3,396.3 tons)
- IMF (2,814 tons)
- Italy (2,451.8 tons)
- France (2,435.4 tons)
- China (1,054.1 tons)
- Switzerland (1040.1 tons)
- Russia (936.7 tons)
- Japan (765.2 tons)
- Netherlands (612.5 tons)
- India (557.7 tons)
- European Central Bank (502.1 tons)
- Iran (500 tons).
Monday, January 14, 2013

$SLV Based on "High/Low/Close" Price Chart
Yesterday, I showed a "Point & Figure Chart" on silver (SLV). Today, the following chart depicts a typical "High/Low/Close" price chart for silver. The difference is that a Point & Figure chart provides a relatively long-term view of price activity, while a price chart, in this case, provides a time frame of one year. I use Point & Figure charts to provide long-term signals and price charts for short-term signals. Generally, price charts are good for indicating "overbought and oversold" levels.


Sunday, January 13, 2013

Is Gold/Silver a Safe Investment for Your Future?
I guess the
answer to that question depends on your time horizon and if you believe in Biblical
prophecy. From a Biblical perspective,
the world’s economic troubles are about to get worse, even worse than what one
can imagine. According to Biblical
prophecy, times will get so bad that people will throw their gold and silver
into the streets. Ezekiel 7:19 states,
“They throw their silver into the streets, and their gold becomes as
filth. Their silver and their gold is
unable to deliver them in the day of the wrath of Yahuah (God).” Why would anyone do that? A famine will occur, as told to John, on
earth similar to the one prophesized by Joseph to the Pharaoh of Egypt in
Genesis 41 but only worse.
Let’s look at that
prophecy as it pertains to this upcoming famine that is described to John in
the sixth chapter of Revelation. Revelation
6:6, which is the “Third Seal,” states, “A measure of wheat for a denarius and
three measures of barley for a denarius.”
[A measure of wheat bakes one loaf of bread, and a denarius was the
equivalent of a day’s wage.] When the
economic system collapses, Ezekiel and John prophesized that one’s gold and
silver will be worthless.
Now, I believe that
gold and silver are a form of insurance for the currency crisis that lies ahead
of us. I like junk (circulated) silver
coins, which are those pre-1964 dimes (.07 ounces of silver), quarters (.18
ounces of silver), and half dollars (.36 ounces of silver). However, for the Day of Yahusha, your
protection is in Yahuah (God), not your gold and silver.
For those of you
that want to learn about your future as it pertains to Biblical prophesy, you
may want to dust off your Bible and read Chapters 6-10 of Revelation.
Thursday, January 10, 2013
Is 807 the New Number (Sign) of the S&P 500 Beast and Not 666?
The following chart is brought to you by way of "Zero Hedge:"


"807" just might be the new sign of the beast for the S&P 500; however, the 807 point rise from March 2009 did start at the infamous "666!"
Wednesday, January 09, 2013
The Lone Wolf at the Federal Reserve System
Jeffrey M. Lacker, who is President of the Federal Reserve Bank of Richmond, has warned repeatedly that the Fed’s extraordinary efforts to stimulate growth are ineffective and inappropriate. Last year, he cast the sole dissenting vote at each of the eight meetings of the Fed’s policy-making committee, which is only the third time in history a Fed official dissented so regularly.
He states, “We’re at the limits of our understanding of how monetary policy affects the economy. The economy continues to muddle along, shadowed by the threat of another government breakdown, and the crisis of high unemployment is only slowly receding. But in trying to address those problems by suppressing interest rates, the Fed risks the unleashing of speculation and inflation." At least, someone at the Fed has some sanity to the ultimate consequences of increasing the Fed's balance sheet in excess of $2 trillion through its QE programs.
He states, “We’re at the limits of our understanding of how monetary policy affects the economy. The economy continues to muddle along, shadowed by the threat of another government breakdown, and the crisis of high unemployment is only slowly receding. But in trying to address those problems by suppressing interest rates, the Fed risks the unleashing of speculation and inflation." At least, someone at the Fed has some sanity to the ultimate consequences of increasing the Fed's balance sheet in excess of $2 trillion through its QE programs.
Tuesday, January 08, 2013

Return "of" My Money

Will Rogers' words of wisdom have never been more relevant in today's investment climate, which will become very obvious over the next three years: "I am more concerned with the return of my money than the return on my money."

Monday, January 07, 2013

Sunday, January 06, 2013
Do You Really Know Where Your Tax Dollars Are Going? I Don't Think You Do!

Wait one minute! I thought that was not permissible under the Federal Temporary Assistance for Needy Families Program. Well, you would be partially correct. Welfare recipients receive food stamps and cash assistance under the Temporary Assistance for Needy Families program. Both
The problem is that currently EBT cards operate like debit cards. That is, recipients swipe them at a participating ATM or grocery checkout and enter their PIN, and the amount is deducted from their balance. Grocery-card transactions can be traced, but cash transactions can’t really be traced. For instance, if that ATM machine is located in strip clubs and liquor stores, do you really believe that the cash transaction is going to be used to pay the rent rather than for a lap dance? And there you have it. Therefore, the next time you see an ATM machine, remember where some of those EBT cash withdrawals just might be going.
What is our government doing about this problem? Good question. I will have to get back to you on that one. Better yet, why doesn't the government simply insert a magnetic device or some device that does not allow an EBT card to be used at an ATM machine?
Price Honesty at One Hospital in the Medical Field
The following video will illustrate how one hospital has dealt with the ever increasing cost of medical care in the United States. Last year, we spent $850 billion at the federal level on medical care, which amounted to 24% of total federal government spending. In 1980, $53 billion was spent on medical care at the federal level. From 1980 to 2012, that spending on medical amounts to a compounded growth rate of 9%. Therefore, if one simply extrapolates that growth rate into the future, the government will spend $1.7 trillion on medical care by 2020, or close to 49% of today's total government spending, which definitely can not be sustained. Keep-in-mind that the $3.5 trillion of government spending is in relation to the $2.3 trillion that the government receives in the form of all taxes. Therefore, if we are going to cut government spending in a meaningful way, we must look at the medical profession. That is, we must look at how the current medical profession is pricing its care in relation to how the Surgery Center of Oklahoma prices its care.
Once you have reviewed the video, go to the Surgery Center of Oklahoma's site and see for yourself its pricing model. If you have recently had surgery at a hospital, you may want to look at your bill and then compare it to the cost of the same procedure at the Surgery Center of Oklahoma.
Wednesday, January 02, 2013

Feds Real Monetary Objective
Charles
Hugh-Smith over at “Of Two Minds” succinctly stated what the Feds real
objective is with the following statement: “One explicit goal in the Fed's “Zero-interest
Rate Policy” (ZIRP) is to drive financial capital into risk assets such as
stocks. As a matter of fact, that is
the Fed’s first-order of business, creating an illusion of prosperity via an
elevated stock market and the resultant "wealth effect" for the 10%
who own enough stocks to matter. Indirect
manipulation is hidden from public view lest the rigging of the market taint
the perception that a rising market is "proof" that Federal Reserve
and Administration policies are "succeeding." Indirect manipulation is achieved via Federal
Reserve quantitative easing operations, unlimited liquidity, and lines of
credit to fund bank speculations and masked buying of market futures.”
Fiscal Cliff is Dead, Sort of ...
America has replaced one fiscal crisis, or cliff, for "four separate cliffs:" the debt ceiling cliff in February/March 2013, the sequester cliff in March 2013, the farm bill cliff in September 2013, and the expiration of jobless benefits on December 2013. But, all those cliffs are in the future. Today, there is absolutely nothing to worry about at all. Our elected Senators and Representatives have everything under control, NOT!
Tuesday, January 01, 2013
Millions of Dollars for Hollywood, Railroads, Rum Producers, and NASCAR
The "Fiscal Cliff" bill includes the following pork:
•
$430 million for Hollywood through “special expensing rules” to encourage TV and film
production in the United States. Producers can expense up to $15 million
of costs for their projects.
•
$331 million for railroads by allowing short-line and regional operators to claim a tax
credit up to 50 percent of the cost to maintain tracks that they own or lease.
•
$222 million for Puerto
Rico and the Virgin Islands through returned excise
taxes collected by the federal government on rum produced in the islands and
imported to the mainland.
•
$70 million for NASCAR by extending a “7-year cost recovery period for certain
motorsports racing track facilities.”
•
$59 million for algae
growers through tax credits to encourage
production of “cellulosic biofuel” at up to $1.01 per gallon.
•
$4 million for electric
motorcycle makers by expanding an existing
green-energy tax credit for buyers of plug-in vehicles to include electric
motorbikes.
Idiots, All of Them


$1 in Cuts (Maybe) for Every $41 in Taxes (Certainty)
The Senate bill doesn't mention or deal with the debt ceiling, and temporarily puts off for two months the so-called sequester that series of automatic cuts in federal spending that would have taken effect tomorrow, January 2. However, what will the House do? It will take up the Senate bill at noon today, January 1. My guess is that the House will pass it with some slight modifications, nothing material. So, in two months, these clowns will go at it again with the same results, which is nothing accomplished to control the unabated government spending.
The best hope for America is for sequestration to actually occur! Why? May, just maybe we would then have an actual and honest debate about the real problem facing America, which is uncontrollable government spending that exceeds government revenues by over $1 trillion a year. However, since I am a realist, I know that this type of honest debate will not happen within our entitlement society.
The best hope for America is for sequestration to actually occur! Why? May, just maybe we would then have an actual and honest debate about the real problem facing America, which is uncontrollable government spending that exceeds government revenues by over $1 trillion a year. However, since I am a realist, I know that this type of honest debate will not happen within our entitlement society.
Subscribe to:
Posts (Atom)