Thursday, October 26, 2006
Halloween Indicator
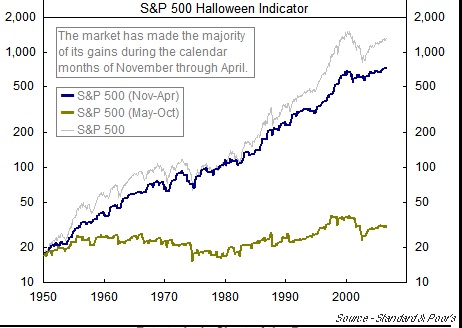
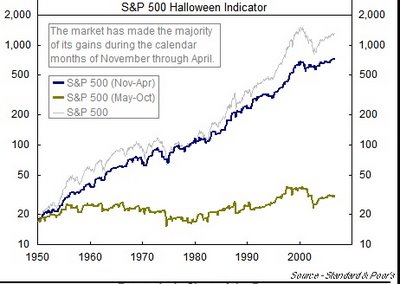
The stock market is now entering what has historically been the strongest half of the year. The following chart, which is from "Chart of the Day," illustrates that investing in the S&P 500 from the last trading day in October, which is why it is referred to as the Halloween indicator, through the end of April accounted for the vast majority of S&P 500 gains since 1950. While there are some noteworthy periods in which the Halloween indicator didn't produce (i.e. 1973-74 & 2000-01), the overall performance is compelling. Therefore, on Tuesday, October 31, buy the S&P 500 Index and hold it until the last trading day of April, which is the 30. Place the proceeds in a "Money Market Account" until the last trading day in October 2007. Perfect formula for worry-free investing. And who said that investing is difficult. Trick or treat, anyone!
Wednesday, October 25, 2006
Saturday, October 21, 2006
History Lesson
"Stock prices have reached what looks like a permanently high plateau. I do not feel there will be soon if ever a 50 or 60 point break from present levels, such as they have predicted. I expect to see the stock market a good deal higher within a few months." - Dr. Irving Fisher, Professor of Economics at Yale University, one of the most important US economists of his day, speaking on October 17, 1929, a few weeks before the Great Crash.
Thursday, October 19, 2006
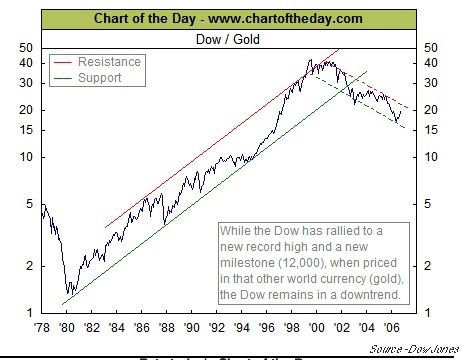
All Time High for the DJIA, or Is It?
The DJIA has moved over 12,000 in terms of dollars; but in terms of gold, it remains in a very well-defined "bear market." See the following chart.
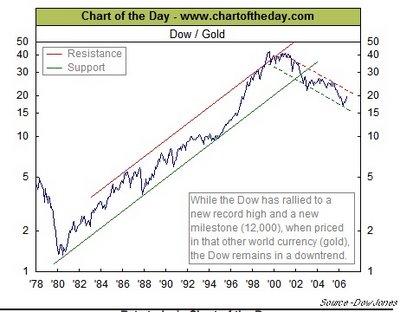 May be we should be purchasing gold, like GLD or GDX, and not equity stocks. What do you think? Make your comments during the coming week.
Saturday, October 07, 2006
Goldilocks' Rally?
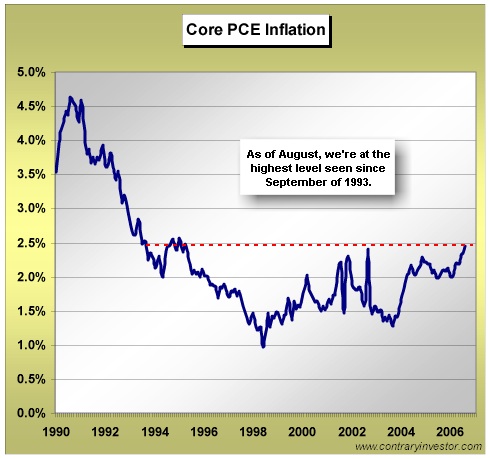
Core Personal Consumption Expenditures (PCE) inflation is the Fed's favorite gauge of measuring price inflation, which went to a high not seen in 13 years, well above the stated Fed comfort zone near the 2% ceiling. See the following chart that is from the Contrary Investor's report of October 3, 2006:

The reason that I present this chart is because the stock market is indeed anticipating that the Fed will soon be reducing its "Fed Funds" rate (January or March) with the market making a "new" this past week. In addition, the rate on the Ten Year TSY (4.75%) is below the Fed Funds rate (5.25%), which in the past has been an excellent harbinger of lower rates. Go to Bloomberg at http://www.bloomberg.com/markets/rates/index.html to see the current interest rate structures. Also, the decline in energy prices, especially oil and natural gas, along with the expectations that corporate earnings for the third quarter are going to be very robust have helped propel the market higher. But, the stock market has completely ignored the recent inflationary comments by several Federal Reserve members, which does not bode well for a cut in interest rates, along with signs that the economy is slowing, as discussed in last week's post.
On Tuesday, Fed Vice Chairperson Donald Kohn stated that he is more concerned about inflation than slowing economic growth because a recession is unlikely. On Thursday, Charles Plosser, Federal Reserve Chairperson of the Federal Reserve Bank of Philadelphia, stated that the Fed's very credibility was at stake when it came to keeping prices under control. He was clearly concerned that the core PCE inflation is above 2%, and he expressed the need to raise the Fed Funds rate, not lower it. Please remember that he, who has the gold, in this case the money, makes all the rules! And the Fed has all the money, therefore, it makes all the rules as it pertains to the financial markets and the economy. Therefore, don't count on the Fed reducing rates unless inflation, as measured by the PCE, comes down below 2%.
Monday, October 02, 2006
Risk-adjusted Rate of Return (Beta Analysis)
You just justed received your annual performance statement from your investment advisor. The statement indicates thaty your portfolio return for the past year was up 12%. In addition, you noticed within the statement that the S&P 500 rose 10%. Also, the statement gave the portfolio's beta, which means nothing to you, was 1.8. Further on, you read that the TSY Bill rate for the time period was 4.75%. To your dismay, the statement did not provide any further explanation. Therefore, you decide to call your investment advisor for clarification on what this all means. As an investment advisor, what is your response to your client? As the client, are your happy with the performance of the portfolio?
Subscribe to:
Posts (Atom)