1. Pause in monetary tightening as indicted by the Fed Funds rate
2. Moderation of inflation as measured by PPI “Core Finished Goods and Core Intermediate”
3. Lower interest rates in the 2+ year maturity range. (Usually if the 2-Year TSY is below the Fed Funds rate, it is a precursor for lower rates.)
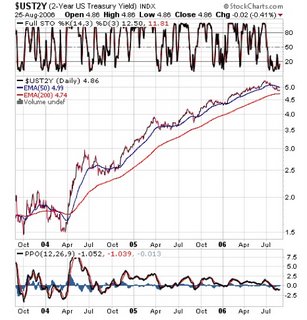
What is the evidential data for the above scenario being successful? Let's see. Number One is a reality. The "Fed" left the fed funds rate at 5.25% at its last meeting. Number Two is 50% reality. The PPI "Core Finished Goods" came in at 1.3% (August 2005 to July 2006). Source is the Federal Reserve Bank of St. Louis at the following URL: : http://research.stlouisfed.org/fred2/series/PPILFE?&cid=31. This is the good news, but, when one looks at PPI "Core Intermediate Goods," the news is not so good. Year-over-year the rate came in at 8.3%. Therefore, inflation is still in the pipeline. See the following link: http://research.stlouisfed.org/fred2/series/PPIITM?&cid=31. Number Three has not been completely resolved. Yes, the 2-Year TSY rate is less that the Fed Funds Rate; however, from a technical perspective, the 2-Year U.S. Teasury Yield Chart might be indicating that higher rates are ahead of us. See the chart, which is from StockCharts.com.
Now, what is your recommendation for the year-end rally?

No comments:
Post a Comment