Friday, August 14, 2009
Thursday, August 13, 2009
S&P 500 Update: for August 13, 2009 Alignment of Stochastics, PPO, and CCI
Recording Quality is not what I want it to be. I just don't know why it is not recording in HD, which it should. Thanks for your patients.
Wednesday, August 12, 2009
Quote for Today
"The problem with socialism is that eventually you run out
of other people's money." (Margaret Thatcher)
of other people's money." (Margaret Thatcher)
Monday, August 10, 2009
Banks Make $38 billion a Year from Overdraft Fees
Please read this post my Karl Denninger over at the Market Ticket.
According to Karl, "70% of the overdrafts happen at an ATM, not by writing a check. The bank knows before they approve the ATM transaction that the money isn't there in the account. It gets better: Banks will intentionally "sort" transactions from a given day to produce the maximum overdraft fee. They sort withdrawals to debit them largest-amount-first, because the fee is assessed per item. An example: You have $1,000 in your account. You write checks for $20, $50, $100, $1,000 and all are presented on the same business day. How many checks will hit you with an overdraft fee? THREE - every time. The bank will re-order the transactions so that the $1,000 check is processed first, guaranteeing that the $20, $50 and $100 checks overdraw, thereby generating three overdraft charges. If they processed the transactions "largest item LAST" you'd generate one overdraft fee - on the $1,000 check."
"But wait, it get better. It gets better. You have that $1,000 in your account. It is after 3:00 PM, the cut-off for a business day. You go to the mall and use your debit card four times to buy a $5 Latte, $15 lunch, a $40 pair of pants and $25 for a couple of movie tickets. The next morning a $1,000 check hits your account. The bank processes the $1,000 check first, even though in terms of actual presentation time the debit card withdrawals were approved first, and whacks you for four overdraft fees instead of the one legitimate fee on the $1,000 check. That Latte just cost you as much as $45!"
"This sort of predation is responsible for nearly $40 billion dollars a year in pure "profit" for the banks, it is directed specifically at those who have the least in resource to cover it, and it relies on lack of clear disclosure and intentionally-predatory "sorting rules" to get past what would otherwise result in a howl of protest by consumers and lawmakers alike."
This is what I want you to do. Forward this post to your banker and ask for an explanation on how they calculate and process those items in determining overdraft fees. Better yet, take a copy to your bank and talk with one of the many Vice Presidents or go directly to the President. Then, send a copy of this post along with your bank's explanation (if they give you one) to your Congressional Representative and Senators.
Saturday, August 08, 2009
Allegiant Air (ALGT): Textbook Example of Using P&F Charts as a Contrarious Indicator
 Note: To enlarge the chart, double-click inside of it.
Let me know if you have any such P&F examples that demonstrate this contrarious indicator. Keep-in-mind it is the extremes at the top or bottom of the page that is relevant. The P&P Charts that I am using are from StockCharts.
Using P&F Charts as a Contrarian Indicator
The first chart depicts the S&P 500 on a Point and Figure Chart. Notice that when the column of O's reaches the bottom of page, which indicates a very oversold condition, the price has a tendency to reverse. Likewise, when a column of X's reaches the top of the page, which indicates a very overbought condition, the price has a tendency to reverse. The second chart depicts DXD (Double-inverse short on the DJIA).
 Note: To enlarge, double-click inside.
 Note: To enlarge, double-click inside.
 Note: To enlarge, double-click inside.
 Note: To enlarge, double-click inside.
Friday, August 07, 2009
S&P 500 Update for the Week Ending August 7, 2009
If we get a buy signal next Friday, August 14, 2009, the signal would become effective Monday, August 17, 2009. The strategy that I will implement is to average back into the market. Over the next four Mondays, if a buy signal is generated, I will allocate 25% of my investment portfolio to the equity side of the market. For a refresher on the various types of Exchange Traded Index Funds (ETFs), refer to my post of Saturday, July 25, 2009.
 Note: To enlarge the chart, double-click inside of it.
 Note: To enlarge the chart, double-click inside of it.
SPX Update
If prices stay firm, we may have a "buy signal" on the weekly exponential moving average strategy. However, do not jump the gun! I will have an update tonight with a purchase strategy that I will be using if we do get the buy signal.
U.S. Deficit Climbs to $1.3 Trillion for the Current Ten Months
The U.S. budget deficit reached 1.3 trillion dollars for the current fiscal year in July 2009 (first ten months with two months to go). The deficit for the first 10 months of fiscal year 2009 is close to 880 billion dollars greater than the deficit recorded for the like period last year (July 2008), said the Congressional Budget Office (CBO).
U.S. Job Losses Slow As Rate Drops to 9.4%
Bureau of Labor reports that job losses declined just 247,000 in July, while the unemployment rate surprisingly fell to 9.4% from 9.5%. Why the improvement? I contend that the answer lies with the "Baby Boomers" leaving the civilian labor force to go on Social Security. Look at the following chart provided by BLS. Notice the decline in the category "Not in the Labor Force" from May to July. So, on the surface the job situation does indeed look better. However, I believe we are going to see more and more "Baby Boomers" apply for Social Security as soon as they are eligible and not wait until they reach 66 or 67. What does that say about the immediate financial viability of Social Security and Medicare?
 Note: To enlarge the chart, double-click inside of it.
Therefore, drop in unemployment rate is caused by drop in the civilian labor force, which I contend was caused by "Baby Boomers" leaving the labor force for Social Security. Let's look at the math with the following example: 19 people are unemployed out of 200 in the labor force = 9.5% unemployment rate. Then, 1 of those unemployed individuals leaves the labor force. Now, 18 people are unemployed out of 199 in the labor force = 9.0% unemployment rate. Folks, it is all about the math!
Wednesday, August 05, 2009
Wall Street Firms Could Collect Nearly $1 Billion from AIG Breakup
Wall Street banks and lawyers could collect nearly $1 billion in fees from the Federal Reserve Bank of New York and AIG to help manage and break apart the insurer, according to the Wall Street Journal. This sounds all to familiar. The government gives Wall Street billions to survive and pay bonuses, and then they receive billions more to bury their dead. What a sweet deal!
Toyota Corolla Overtakes Ford Focus as Top Seller
Sorry Ford, but at least you held the first-place status for one day! Where are GM and Chrysler?
Four of Top ‘Clunkers’ Model Purchases Are Foreign
Bloomberg reports, "Four of the top five models sold so far under the U.S. 'cash for clunkers' program are made by foreign automakers, according to Transportation Department data." Ford's Focus was the top seller (good for Ford), followed by Toyota’s Corolla, Honda’s Civic and Toyota’s Prius and Camry. What is missing from the list? Of course, there is "NOT" one of the Government Motors (GM) models in the top five. Surprise, surprise, surprise!!!
Tuesday, August 04, 2009
GMAC in Talks With Fed on New Capital Infusion
GMAC, which said that its second-quarter loss widened to $3.9 billion (Review my previous post on this subject.) and acknowledged it's in discussions with the Federal Reserve System on the $5.6 billion in new financial capital it needs. This is a joke, isn't it? Sad to say, but it's the truth.
Americans, when are we going to rise up and say enough is enough? I am beginning to believe that we, as taxpayers, are just sheep waiting to be slaughtered. I, for one, will not go down without a fight.
I know that the individuals that read this blog are well-informed and do care for this country. We may have different political views and agree to disagree, but we do care deeply about this country. We have to get involved and tell our Congressional Representative and Senators to stop this insanity that will for sure bankrupt our country.
Close, But No Cigar
Remember that the 15-Week EMA must close above the 40-Week EMA on Friday's close, not tomorrow or Thursday.
 Note: To enlarge the chart, double-click inside of it.
 Note: To enlarge the chart, double-click inside of it.
Personal Income for June
The Bureau of Economic Analysis (BEA) reports that Personal income decreased $159.8 billion, or 1.3 percent, and disposable personal income (DPI) decreased $143.8 billion, or 1.3 percent, in June. Personal consumption expenditures (PCE) increased $41.4 billion, or 0.4 percent. Now, let me get this straight. Income is down, but consumption is up. Oh, the consumer had to take on more debt. Read on.
Karl Denninger from the "Market Ticker" had this to say about the income numbers. "What's worse in the income and spending report is that "saving" (actually debt paydowns) has decreased; this is particularly troubling given the continuing over-leveraged state of the consumer. The last thing we need in our economy is yet more debt defaults driving even more economic contraction, but it appears that's exactly what we're going to get."
"Oh, and don't look at tax receipts either: they're down huge, with individual income tax receipts down some 22%! The last time we saw numbers like this was The Depression; you can claim that personal income is down "only" 2% if you'd like, but the last time I checked you only paid tax on income actually received, and while the tax system is progressive there is no way you can square a 2% "reported" income decline with a 22% decline in income tax receipts. Someone's lying and I'm quite confident that people aren't paying taxes on money they didn't earn!"
He Who Has the Gold, Makes the Rules
"Let me issue and control a nation's money, and I care not who writes the laws." Mayer Amschel Rothschild (1744-1812)
Tax Dollars Wasted: GMAC Looses Billions (So, What Else is New?)
First, an excerpt from my posting of Tuesday, December 30, 2008 (Please go back and read the complete post): "GMAC reduced the credit score necessary to get a loan from 700 (very good) to 621 (not very good.) Do you believe this? I am loathed at how they are wasting my money as a taxpayer. Everyone that reads this blog should send a copy of this posting to his/her Representative and Senators demanding accountability. By the way, the median (average) FICO score in the United States is 723."
Second, there are consequences for such stupidity (to coin a word from President Obama) from GMAC. "GMAC, who received $13.5 billion in government bailout funds, reported a $3.9 billion second-quarter loss tied to rising loan defaults and said it may sell part of its insurance operations. The loss, GMAC’s seventh in the past eight quarters, rose from $2.48 billion a year earlier." What do you expect when you reduce one's credit score from 700 to 621! Then again, it is not GMAC's money, it is the American taxpayer.
Please forward this posting and the posting from December 30, 2008 to your Representative and Senators and remind them how you intend to cast your next Congressional and Senatorial votes.
Sunday, August 02, 2009
Summary of Latest Federal Individual Income Tax Data
The Internal Revenue Service has released new data (July 30, 2009) on individual income taxes, reporting on calendar year 2007, a year in which the economy remained healthy and continued to grow.
In 2007, the top 1 percent of tax returns paid 40.4 percent of all federal individual income taxes,and earned 22.8 percent of adjusted gross income (AGI). Both of those figures, share of income and share of taxes paid, are significantly higher than they were in 2004 when the top 1 percent earned 19 percent of adjusted gross income (AGI) and paid 36.9 percent of federal individual income taxes.
That means the top 1 percent of tax returns paid more in federal individual income taxes than the bottom 95 percent of tax returns. Ok, what adjusted gross income (AGI) qualifies you for the top 1% status? Any dollar amount greater than $410,096. Not what I would consider to be super, super rich; but a whole lot less than what a lot of individuals would have guessed.
The top 5% of taxpayers (AGI over $160,041) paid 60.63% of all individual federal income taxes. The top 10% of taxpayers (AGI over $113,018) paid 71.22% of all individual federal income taxes. The top-earning 25 percent of taxpayers (AGI over $66,532) earned 68.7 percent of the nation's income, but they paid 86.6% of all federal individual income taxes. The bottom 50% (AGI less than $32,879) of all taxpayers paid 2.89% of all federal income taxes.
Therefore, I would surmise from the "2007 Individual Income Tax Data" that anyone whose AGI is greater than $66,000 will see a significant increase in their federal tax burden to cover the ever expanding cost of the federal government. (Did anyone say a national sales tax coming soon, like the VAT in Europe?) And, keep-in-mind that this summary was about your federal tax burden, not your state tax burden that will also be increasing in the near future!
 Note: To enlarge table, double-click inside of it.
Source: The Tax Foundation
Saturday, August 01, 2009
Weekly Update on S&P 500: 15- and 40-Week EMAs
I have expanded the time horizon for this week's update. The weekly S&P 500 chart goes back to 1972 (some 37 years). What I want you to observe is how accurate the exponential moving average strategy has been in identifying long-term bull and bear markets.
Most market pundits have already preordained that a new bull market is upon us! The cover of Newsweek just proclaimed that the "recession" is over. For me, I will let the exponential moving address speak for itself. Until the 15-week EMA exceeds the 40-week EMA on a Friday's close, everything else is market noise.
 Note: To enlarge the chart, double-click inside of it.
Friday, July 31, 2009
Your Tax Dollars at Work: This should make you fighting mad!
NEW YORK (AP) -- Citigroup Inc., one of the biggest recipients of government bailout money, gave employees $5.33 billion in bonuses for 2008, New York's attorney general said Thursday in a report detailing the payouts by nine big banks.
The report from Attorney General Andrew Cuomo's office focused on 2008 bonuses paid to the initial nine banks that received loans under the government's Troubled Asset Relief Program last fall. Cuomo has joined other government officials in criticizing the banks for paying out big bonuses while accepting taxpayer money.
Citigroup, which is now one-third owned by the government as a result of the bailout, gave 738 of its employees bonuses of at least $1 million, even after it lost $18.7 billion during the year, Cuomo's office said. The bank's top four recipients received a combined $43.7 million.
Bank of America, which also received $45 billion in TARP money, paid $3.3 billion in bonuses, with 172 employees receiving at least $1 million and the top four recipients receiving a combined $64 million. Merrill Lynch, which Charlotte, N.C.-based Bank of America acquired during the credit crisis, paid out $3.6 billion, including a combined $121 million to four top employees.
Bank of America earned $2.56 billion in 2008, while Merrill lost $30.48 billion. Cuomo's office said Merrill Lynch doled out 696 bonuses of at least $1 million for 2008.
Goldman gave 953 workers bonuses of at least $1 million, with its four most highly compensated employees receiving a combined total of nearly $46 million. JPMorgan gave 1,626 employees at least $1 million, and its top four recipients received a combined $74.8 million. The two banks each gave more than 200 employees bonuses in excess of $3 million.
Thursday, July 30, 2009
Wall Street Analysts Keep Telling Big Earnings Lie
"At a time when the financial industry’s credibility is at an all-time low, you would think Wall Street’s finest would break their necks providing transparency.
Not so. Stock analysts continue to promote corporate earnings lies, insisting that net income isn’t really what investors need to know.
Instead, their earnings estimates ignore often huge expenditures that can’t help but affect a company’s health.
In analystspeak, Intel Corp. wasn’t hit with a $1.45 billion fine from the European Union in the second quarter for anti-competitive practices.
After setting aside funds to cover the fine, which Intel is appealing, the semiconductor-maker had a quarterly loss of $398 million, or 7 cents a share. Disregarding the fine altogether, analysts maintain the company earned 18 cents a share, beating their average estimate of 8 cents.
As Wall Street tells it, the employee stock options Google Inc. granted in the second quarter didn’t cost its shareholders $293 million.
Google, according to generally accepted accounting principles, earned $1.48 billion, or $4.66 a share, in the period. Not enough for Wall Street, which prefers to say the company earned $5.36 a share, leaving out the cost of stock options."
For the full article, go to Bloomberg.
Wednesday, July 29, 2009
Hot Off the Press!
Newsweek declares the recession is over. (LOL) Boy, have I been waiting for this news. We can all sleep better tonight knowing that good times are here again. Thank you, Newsweek.
Let's see. From the $787 billion stimulus plan, the government only had to spend 5% ($39 billion) of it to get us out of the recession. Will Congress now cancel the remaining $748 billion part of the stimulus package?

Let's see. From the $787 billion stimulus plan, the government only had to spend 5% ($39 billion) of it to get us out of the recession. Will Congress now cancel the remaining $748 billion part of the stimulus package?

Government Approval Index
I wish someone, say the ProFunds Group, would come up with an exchange traded note (ETN) that measures an approval index for Congress. We have indexes to trade on just about everything else, why not Congress? Boy, would that be fun to trade.
Government Discovers That Paper Has Two Sides!
Governmental Agencies responded to a presidential savings challenge by trimming 0.006% off the $2 trillion deficit. Among the cuts: close unused email accounts and photocopy both sides of a page. Don't just love the overall "efficiency" of our government. Just think of the efficiencies and savings that we will reap when the government takes over health care.

The Politics of Oil Speculation: Pre-emptive Scapegoating Over Rising Oil Prices
The following excepts are from today's WSJ's "Opinion Page (editorial insights)." I want to draw your attention to the second paragraph that puts forth an hypothesis for the real reason behind the CFTC pronouncement yesterday.
"Last summer, as oil prices were peaking, the Commodity Futures Trading Commission "CFTC" launched an investigation into whether $100-plus oil was the result of market manipulation by those “speculators.” That interim report, issued in July 2008, concluded that price movements were largely driven by—wait for it— supply and demand. The report noted, among other findings, that so-called speculators were net short during some of the biggest run-ups in oil prices over the past several years. In other words, they were, if anything, putting downward pressure on prices during some big spikes. The CFTC also found that markets in which futures trading is outlawed altogether—such as onions (yes, onions)—price volatility tended to be even greater than in commodities like oil with deep and efficient futures markets."
"So the CFTC is now poised to issue a follow-up repudiating the commission’s earlier findings. This week’s hearings are being held without the benefit of the CFTC’s actual findings, which are due out in August—but no matter. The CFTC’s about-face is all about the politics, not the economics, of price discovery. And the real goal is not to blame the evil speculators for last year’s price spike or this year’s oil rally, but to lay the groundwork for explaining away the commodity-price bull run that we’re likely to see as a result of the Federal Reserve’s easy money and the Obama Administration’s spending and debt party."
Saturday, July 25, 2009
Equity Index Exchange Traded Funds (ETFs)
As an investor, you have two to three choices as it pertains to the amount of leverage that you want to assume if and when the exponential moving average triggers a buy signal (See the following Bullish Investment Strategy). For example, in the following table, SPY (+1x) means that you are purchasing an ETF on the S&P 500 that replicates the move in the underlying security (one for one). In other words, if the S&P 500 increases by 5%, SPY would replicate the 5% move. If you want more leverage, say 300% or 3x, you would purchase the UPRO (+3x). Now, if the S&P 500 increases by 5%, the UPRO would increase by 15%, or 3x the increase in the S&P 500.
Bullish Investment Strategy: When the 15-week EMA exceeds the 40-EMA on the S&P 500 (weekly close), which would trigger a bullish signal, you have to decide on the amount of leverage (risk) that you want to assume. Let’s assume that you have $300 dollar portfolio. In addition, you do not want to assume risk greater than that associated with the S&P 500. Given that scenario, you have three strategies that you could implement: (1) purchase $300 worth of SPY, which would replicate the price movement of the S&P 500, one for one, (2) purchase $150 worth of SSO, which would replicate 2x the movement in the S&P 500 and invest the remaining $150 in a money market instrument, such as BIL that replicates the return on 1-3 month Treasury bills (Your overall risk would be approximately the same as in strategy 1, but you are earning interest on the $150 invested in a money market instrument.), (3) purchase $100 worth of UPRO, which would replicate 3x the movement in the S&P 500 and invest the remaining $200 in a money market instrument, such as BIL (Your overall investment risk would be the same as in strategy 1 as delineated under strategy 2.).
 Note: To enlarge the table, double-click inside of it.
Comprehensive Exchange Traded Fund (ETF) Guide
As I prepare to post some of my favorite "bullish and bearish" ETFs, I thought it would be a good idea to provide some background information on exchange traded funds. A great source is at ETF Guide.
Friday, July 24, 2009
S&P 500 Update for the Week Ending July 14, 2009: Moment of Truth
The first chart provides the 15-week EMA and the 40-week EMA, which is still bearish (15-week EMA < 40-week EMA). The second chart utilizes two simple moving averages (10-week and 40-week), which has turned bullish. Which one has an unblemished record over the past decade? Answer: EMA. That is why I monitor the 15-week EMA and 40-week EMA for my investment signals. Keep-in-mind that since weekly data is involved, the signal is taken at the close of the week (Friday). Therefore, if we have a buy signal (15-week EMA > 40-week EMA) on a Friday, one would move into equities, preferably exchange traded funds (ETFs) on Monday. I will provide a list of my favorite ETFs on my next post. Have a great weekend! Note: To enlarge the chart, double-click inside of it.
 To enlarge the chart, double-click inside of it.
 Note: To enlarge the chart, double-click inside of it.
 To enlarge the chart, double-click inside of it.
Stock Market Exuberance
Wow! The bulls are definitely back in town. I want to provide some of my reasons for the strong market performance here lately. I will start with the consumer and provide my reasons why the consumer will not lead us into the next economic recovery. Then, I will focus on corporate profits and some selective components of GDP.
Consumer spending is about 70% of GDP. Therefore, I contend that no consumer spending, no substantial growth to GDP. Further, consumer spending cannot increase materially as unemployment heads to 10%+ (The employment growth for the current decade will clearly be negative by the end of this year.), wages are stagnant, in spite of the minimum wage going to $7.25, capacity utilization rests at the lowest level ever recorded (67%), and average hours worked hit a record low in June, as did the year over year change in aggregate weekly hours. In addition, since consumer credit hit a top of $2 trillion in January of 2009, only $60 billion has been reduced. No, the consumer deleveraging is not complete. And, credit card companies are aggressively cutting credit lines back significantly, in some cases to open balance amounts. These facts simply suggest that the consumer is not ready to aggressively lead this economy forward.
If these are indeed the sober facts, then why has the market acted so well? The answer is based on corporate cost cutting that has definitely enhanced the performance of corporate earnings during the current quarter. Let me explain it in the following way. The largest corporate expenditure is labor cost, and labor cuts have definitely boosted the corporate bottom lines. That is why Wall Street has responded in such a positive way. However, can the US economy recover and begin to grow based on labor cost cutting measures? What is good for corporate bottom lines is not good for employee wages, job growth, and, of course, consumer spending! Something has to give. What we have seen so far this quarter is that corporate earnings have come in above expectations (Market has loved it.), because of the cost cutting endeavors by corporate America. But, the revenues were below expectations. Corporate earnings increased solely on cost cutting measures, especially labor, not revenue growth. That is a real problem. Wall Street definitely is placing a lot of hope on revenue expanding during the second half of the year. I just don’t see it happening as long as the labor cuts continue, and the consumer continues to deleverage.
As just mentioned, I firmly believe the consumer will not be the catalyst for the next economic recovery phase, based on my aforementioned rationale. And, it is hard to see the catalyst being corporate America. I believe the true harbinger for “true” economic growth will only come from growth in capital expenditures and, of course, corporate labor numbers, which are currently dismal. Keep your eyes on those two measures. If those measures do not rebound quickly, I believe Wall Street is going to be in for a big awakening.
Another reason for the market gains is simply mathematics. In recent quarters, several critical components of GDP have declined at astounding negative annual rates (30% to 40%), such as housing, automobiles and business investment and inventories. Eventually, those huge negative numbers on a year over year basis will start to look a whole lot better. As an example, let’s say that housing on a year over year basis from June 2008 to June 2009 is down 40%. Next month (July), the housing numbers are still negative but on a year over year, they are down 10%. That change alone would have a positive impact to GDP growth. Notice that the move from -40% to 10% doesn’t constitute a boom, but merely slowing in the decline. Housing constitutes approximately 3% of GDP. In my example, that improvement, even still negative, would add about 1% to GDP.
Many analysts think housing may in fact bottom out in the third or fourth quarter of this year. Autos may already have passed their low point. Over the past year, inventories have been liquidated at an unprecedented rate. That, too, must come to an end. As inventory change turns from a large negative number into a less negative number. GDP will get another a big boost. Therefore, the numbers, year over year, are bound to look better.
Therefore, Wall Street recent gains have been based on better than expected corporate profits that are based solely on cost containment and reduction, not revenue growth, and year over year improvements in the statistics on housing, auto, and business inventory numbers. I, for one, do not believe that Wall Street has fully comprehended the possibility that these statistical improvements may turn out to be nothing more than a shooting star.
I will have the weekly exponential moving updates on the S&P 500 either later tonight or over the weekend. We are nearing a critical junction in relations to the 15- and 40-week EMA. One stock market model that I track had the market bottoming in April 2009, which, so far, the low was March, and topping in June 2011. To say the least, I really did anticipate that the S&P 500 would trade in the 800 to 850 levels before it would trade at 979. However, let’s keep in mind that the exponential moving average strategy moved us out of equities in January 2008 when the S&P 500 was at 1,401. At today’s close of 979 on the S&P 500, that is still down 30% from January 2008 level.
Cash for Clunkers
Cash for your clunker starts today! Here's how it works: If you own a 1984 or newer vehicle that has been insured and registered to you for the past year and gets a "combined" 18 miles to the gallon or less, you can qualify. The car must also be drivable.
If you trade it in for a car that gets an additional four more miles per gallon or more, your reward is a $3,500 voucher, which can be used toward purchasing a new car. If you switch to a vehicle that gets 10 miles-per-gallon or more in fuel efficiency, then the government gives you $4,500.
To see if your used car has a qualifying miles-per-gallon rating, the Department of Energy has set up a Web site with the official used car mileage ratings called Fuel Economy. By the way, the site also provide the "carbon footprint" for you vehicle(s). This knowledge will assist you in determining how much extra in taxes that you will eventual have to pay when the "Cap and Trade Bill" is finally passed.
For me, my carbon footprints for my 2007 Honda Civic, 2005 Honda Pilot, 1995 Mazda Millenia, and 1989 Isuzu Pickup are 6.3, 10.8, 9.2, and 11.4, respectively.
Monday, July 20, 2009
TWENTY-FOUR TRILLION DOLLARS ($24,000,000,000,000)
The government’s top watchdog, Neil Barofsky, over the $700 billion TARP financial rescue package said the Treasury Department has "repeatedly failed" to adopt his recommendations that would make the program more transparent and accountable to taxpayers.
He will tell lawmakers on Tuesday that taxpayers are being left in the dark about what banks are doing with bailout money, don't know the value of the government's investments, and will not know the full extent of how the money is invested. [Once again, these are the folks that want to run our health care system!]
Barofsky said that while the TARP program that Congress passed amounts to $700 billion, the total federal government support since 2007 for the economy and the financial sector could reach a far higher figure of $23.7 trillion. That is approximately $80,000 for every legal man, woman, and child in the U.S.
We have no one to blame except our selves. This is blatantly unconstitutional. We're talking about nearly double the nation's GDP in debt commitments and more than thirty-three times the amount authorized by Congress. What is going on? Where was the Congressional appropriation for that $24,000,000,000,000?
For the complete article, click-on the Hill.
Ham Update
The references to "2 pound frozen ham sliced" are to the sizes of the packaging. The contract in question purchased 760,000 pounds of ham for $1.191 million, at a cost of approximately $1.50 per pound. Now, I don't know about you, but I can purchase that same size ham for approximately $.75 per pound. Check it out the next time you are at your local grocery store. Oh, this is the same government that is telling us that through government efficiencies of running our health care system, they will save billions of dollars. Does anyone out there really believe the government's rhetoric?
Recovery.Gov
The $787 billion stimulus plan was sold on the underlying concepts of "job creation." So far, that concept is no where to be found. However, some of stimulus money went to fund, not create new jobs, the following items: $2.5 million for ham, water added, cooked, frozen, and sliced, $1.2 million for two pound frozen ham sliced, $350,000 for replace and upgrade a dumbwaiter, $1.6 million for cheese, $16 million for canned pork, and $1.4 million for door repairs. Good site to visit is Recovery.gov.
Saturday, July 18, 2009
S&P 500 Update for the Week Ending July 17, 2009
S&P 500 closed the week at 940.38, which is right at the 40-week EMA. Since the 15-week EMA is still beneath the 40-week EMA, investors are still in a defensive position. However, saying that, notice how the 15-week EMA is rising; and the 40-week EMA has flattened out. Also, notice the potential "Head and Shoulder Bottom Formation," which does have bullish implications. In addition, the RSI has once again moved back above 50.
I am still in the bearish school, because the 15-week EMA < 40-week EMA. However, when and if the 15-week EMA > 40-week EMA, I will immediately become "BULLISH."
 Note: To enlarge the chart, double-click inside of it.
Over the next week, I will be providing a number of "bullish" index ETFs for you to start tracking.
Thursday, July 16, 2009
Joe Biden: We Have to Go Spend Money to Keep From Going Bankrupt
Vice President Joe Biden told people attending an AARP town hall meeting that unless the Democrat-supported health care plan becomes law the nation will go bankrupt and that the only way to avoid that fate is for the government to spend more money. And many thought Dick Chaney was a poor excuse for a Vice President, but Biden takes the prize for being completely economic illiterate.
July 2009: Deadliest for U.S. Forces in Afghanistan
Twenty-four (24) Americans have been killed in Afghanistan this month, according to statements by the U.S. The rate of deaths in July is approaching some of the highest levels of the Iraq war.
Question: Why aren't the main-stream media sources reporting these deaths as they did on a nightly basis during the Irag war? Answer: The Irag war was Bush's war. The Afghan war is Obama's war, and he can do no wrong.
Question: Why aren't the main-stream media sources reporting these deaths as they did on a nightly basis during the Irag war? Answer: The Irag war was Bush's war. The Afghan war is Obama's war, and he can do no wrong.

CIT Rescue Talks Collapse
The "Wall Street Journal reports CIT reported Wednesday "that there is no appreciable likelihood" it will receive fresh government support in the near future." "Talks with the government were complicated by conflicting signals over who was leading them. Some say Treasury officials were in charge, others say the Federal Reserve headed the talks, while still others say that the main focus was on decisions at the FDIC."
Therefore, because of the bureaucracy involved between and among the Federal Reserve, Treasury, and FDIC, there were no clear lines of authority about who should decide about granting a bailout to CIT. So, by default nothing was done! I would consider that to be a moral victory by default. You have to love it, but, then again, this is a perfect example of governmental bureaucracy at its best.
Now, let the market place decide the fate of CIT.
Tuesday, July 14, 2009
Here We Go Again: CIT
CIT, you had more than a year to get your house in order. You had more than two years of watching your stock plummet, from a high of $61.59 in the early 2007 to $1.35 yesterday. During this time, your only strategy was to to form a bank-holding company to get a government bailout. The reason that your strategy has not worked is because the FDIC was against it. Good for them! But, now the Federal Reserve and the Treasury are involved, which quite frankly probably means a bail-out for you. Bad for the U.S. taxpayer and shame on the Fed and Treasury!
We cannot, as a nation, keep doing these bailouts. Sooner or later, if we continue down this path of bailing out everyone, we will find ourselves in a total economic collapse. I, for one, am rapidly losing faith that we will survive as an economic power.
We cannot, as a nation, keep doing these bailouts. Sooner or later, if we continue down this path of bailing out everyone, we will find ourselves in a total economic collapse. I, for one, am rapidly losing faith that we will survive as an economic power.
Monday, July 13, 2009
Next Nationalized Industry: Airlines?
"The Wall Street Journal reported today that the recession, plunging travel demand, and a tough lending environment are battering U.S. airlines, raising the prospect of a liquidity squeeze that could lead to bankruptcy filings by winter if conditions don't improve. The five largest carriers are expected to report second-quarter losses."
"Some carriers may have no choice but to seek protection from creditors this winter, or as early as this fall, when cash flow typically dries up. United, American and US Airways are the most vulnerable among large carriers, according to credit-rating agencies and Wall Street investment houses." (Start using up your frequent flier miles now before it is too late!)
"Some carriers may have no choice but to seek protection from creditors this winter, or as early as this fall, when cash flow typically dries up. United, American and US Airways are the most vulnerable among large carriers, according to credit-rating agencies and Wall Street investment houses." (Start using up your frequent flier miles now before it is too late!)
Sunday, July 12, 2009

Brilliant Political Strategy or What?
We are being told that only 10% of the original $787 billion stimuli plan has been expended. The remaining 90% will finally get into the economy during the next one to two years. With unemployment at 9.5% (U6 rate of unemployment is already 16.5%, which is the true rate of the unemployment percentage.), which equates to something like 15 million people out of work, there is clamor by some on the Hill for another stimuli package. http://www.bls.gov/news.release/empsit.t12.htm
I, for one, consider that the Obama team really believes the eventual time horizon for that remaining 90% is a brilliant political move on their part. Why else would they delay 90% of the expenditures until next year? My reasoning will follow shortly.
No one can doubt his overall popularity and what it has gotten him so far. For instance, in his first six months, he has been able to nationalized specific segments of the financial industry and, of course, the auto industry. Now, he wants to nationalized our health-care system and has introduce the largest indirect tax on the American people through the “Cap and Trade” bill, which has been passed by the House and currently being debated in the Senate. Now, popularity only goes so far in Washington, D.C., as witnessed by the fact that more people currently disagree with his handling of the economy than approve of his handling of it.
Now, because of his popularity and the Democratic controlled Congress, President Obama will probably get his social agenda passed in one form or another. However, in doing so, he will have used up most of his political capital this year. I believe that the electorate will become increasing disenchanted with President Obama as the unemployment rate heads above 10%. Remember President Clinton saying during his campaign for the presidency that "it is about the economy." Obama knows that, and he knows that so very well. But again, when will that 90% of the $787 billion get into the economy? Of course, that 90% will start stimulating the economy in 2010. And, what happens in 2010? The mid-term Congressional elections will occur. Obama believes that the 90% will be more than sufficient to not only stimulate the economy out of the recession, for which he and the Democrats get the credit, but to assist in electing Democrats back to Congress next year. This time lag, stimuli strategy is brilliant. However, if the economy does not improve next year, and the Democrats lose seats in the upcoming mid-term election; President Obama can still push through a “second” stimulus plan to assist him in his 2012 reelection campaign. Time will tell if this is a brilliant strategy after all or not.
Saying all that, I don’t believe the stimuli will grow the economy in real terms. I firmly believe that we cannot spend our way out of this economic malaise in a time when the American people are deleveraging themselves from debt. It has not worked in the past, and it will not work now. Real economic growth occurs through real investments/savings, not by government spending through monetarization.
Saturday, July 11, 2009
Stashing Cash in Banks: Is it Really Safe?
The FDIC has a calculator on its site called EDIE, or Electronic Deposit Insurance Estimator, to help determine whether you are fully covered at your bank. You can determine if you are covered by clicking on EDIE and going through a few calculations.
The standard insurance amount currently is $250,000 per depositor. The $250,000 limit is
permanent for certain retirement accounts, which includes IRAs. The $250,000 limit is temporary for all other deposit accounts through December 31, 2013. On January 1, 2014, the standard insurance amount will return to $100,000 per depositor for all account categories except certain retirement accounts, which will remain at $250,000 per depositor. However, structure your holdings correctly and, as an individual, you can obtain more than $1 million in coverage per bank. A couple can get about $2 million in coverage per bank. Click-on "FDIC Coverage" for a synopsis.
Friday, July 10, 2009
DXO: Ultra-long Oil
$3.50 still remains the critical price mass for DXO. Technically speaking, the price could decline to $3.40 and still remain bullish. Anything less than $3.40 would generate a "High-Pole Formation," which would render a bearish scenario. (See comments within chart.) Note: To enlarge the chart, double-click inside of it.
 Note: To enlarge the chart, double-click inside of it.
Tuesday, July 07, 2009
Today's Comments
Comments for today, July 7, can be read at Twitter. Currently, I am looking for some near term market relieve to eliminate some of the oversold conditions as seen on the hourly charts. S&P 500 is poised to drop to the 800 level.
Sunday, July 05, 2009

Saturday, July 04, 2009

Friday, July 03, 2009
Bollinger Bands
Developed by John Bollinger, Bollinger Bands are an indicator that allows users to compare volatility and relative price levels over a period time. The indicator consists of three bands designed to encompass the majority of a security's price action.
1. A simple moving average in the middle
2. An upper band [SMA plus 2 standard deviations (SD)]
3. A lower band [SMA minus 2 standard deviations (SD)]
For general time frames, Bollinger recommends a 10-day simple moving average (SMA) for the short term, a 20-day simple moving average (SMA) for the intermediate term and 50-day simple moving average for the long term.
BigCharts use a 20-day SMA but does not display the SMA in the chart. It incorporates the upper band (2 SD above SMA) and lower band (2 SD below the SMA). Notice how well the Bollinger Bands contained the weekly closing prices of the S&P 500 over the past ten years, especially the price activity over the past several weeks! See the following chart. Note: To enlarge chart, double-click inside of it.
It should be noted that Bollinger did not use this indicator to generate buy and sell signals when prices reach the upper or lower bands. Such levels merely indicate that prices are high or low on a relative basis. A security can become overbought or oversold for an extended period of time. However, knowing whether or not prices are high or low on a relative basis should assist and enhance one’s buying and/or selling decisions.
Source: StockCharts.Com
1. A simple moving average in the middle
2. An upper band [SMA plus 2 standard deviations (SD)]
3. A lower band [SMA minus 2 standard deviations (SD)]
For general time frames, Bollinger recommends a 10-day simple moving average (SMA) for the short term, a 20-day simple moving average (SMA) for the intermediate term and 50-day simple moving average for the long term.
BigCharts use a 20-day SMA but does not display the SMA in the chart. It incorporates the upper band (2 SD above SMA) and lower band (2 SD below the SMA). Notice how well the Bollinger Bands contained the weekly closing prices of the S&P 500 over the past ten years, especially the price activity over the past several weeks! See the following chart.
 Note: To enlarge chart, double-click inside of it.
It should be noted that Bollinger did not use this indicator to generate buy and sell signals when prices reach the upper or lower bands. Such levels merely indicate that prices are high or low on a relative basis. A security can become overbought or oversold for an extended period of time. However, knowing whether or not prices are high or low on a relative basis should assist and enhance one’s buying and/or selling decisions.
Source: StockCharts.Com
S&P 500 Update for the Week Ending July 2, 2009
The S&P 500 was repelled at the “declining” 40-Week EMA and is now right on support (896), which is the rising 15-Week EMA. See the following chart. [In order to give a valid “buy signal,” the 15-week EMA must be rising when it penetrates the 40-Week EMA, which also must be rising.] Also, the relative strength chart (RSI) has now turned down from slightly above 50 to slightly below it. In bull markets, RSI remains consistently above 50, and in bear markets, RSI remains consistently below 50. See the following chart.
Therefore, the critical price is 896. A weekly close below this level would probably foreshadow a decline to 800-850. Note: To enlarge the chart, double-click inside of it.
Therefore, the critical price is 896. A weekly close below this level would probably foreshadow a decline to 800-850.
 Note: To enlarge the chart, double-click inside of it.
Monday, June 29, 2009

TSY and Agency Securites: Who is Buying?
The following two charts, curiosity of Contrary Investor, depicts the overall trend of foreign purchases of Treasury and Agency securities. My comments are provided within each chart.
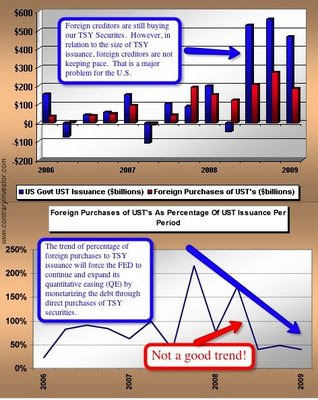

I firmly believe that "Quantitative Easing (QE) through debt monetarization will not only continue but will be expanded. QE is a main reason why I have become more bullish to gold (GLD) and silver (SLV). GLD and SLV, based on technical analysis, are both looking very attractive. Stay tuned!


I firmly believe that "Quantitative Easing (QE) through debt monetarization will not only continue but will be expanded. QE is a main reason why I have become more bullish to gold (GLD) and silver (SLV). GLD and SLV, based on technical analysis, are both looking very attractive. Stay tuned!
Sunday, June 28, 2009
Weekly Update on S&P 500: 15- and 40-Week EMAs
 Note: To enlarge the chart, double-click inside of it.
I will be watching UGL and AGQ very closely this week for potential buy signals. Alignment between and among PPO, Stochastics, and CCI are just about in place for those 200% leverage ETFs. I still have a position DTO. I will be updating on Twitter. Therefore, if you want to follow my inter-day market updates on ETFs and ETNs that I am following, go to Twitter.Com/DeBauche.
Thursday, June 25, 2009
UGL (Ultra-Gold): 200% Leverage
I mentioned on Twitter today that gold and silver are starting to "look" attractive. The only part of the puzzle that is not in alignment is PPO. Full Stochastics and Community Channel Index (CCI) are already "flashing" a buy signal. Let's wait until that final piece of the puzzle is in place before committing any financial resources. See the details about UGL in the following chart: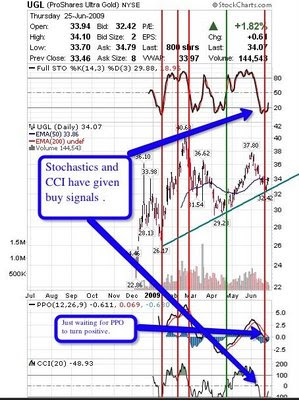 Note: To enlarge the chart, double-click inside of it.
 Note: To enlarge the chart, double-click inside of it.
Wall Street Journal: Climate Bill Biggest Tax in American History
The Wall Street Journal reports that the Cap and Trade would cost the economy $161 billion in 2020, which is $1,870 for a family of four. As the bill's restrictions kick in, that number rises to $6,800 for a family of four by 2035. For the full article, click-on Cap and Tax Fiction.
What a great way to grow the economy! Where is our sanity?
What a great way to grow the economy! Where is our sanity?
Wednesday, June 24, 2009
$100,000 of Your Tax Money to Breed Wyoming Toads
Once again, I am not that creative to make this stuff up. Read all about it at Grants.Gov.
Warren Buffett to CNBC: U.S. Economy In "Shambles"
"In a live interview on CNBC today, Warren Buffett said there has been little progress over the past few months in the "economic war" being fought by the country. "We haven't got the economy moving yet." While the economy is a "shambles" and likely to stay that way for some time, he remains optimistic there will eventually be a recovery over a period of years. Despite his negative view on the economy, Buffett still believes the stock market is attractive "over the next 10 years" when compared to alternatives like Treasury bonds." For the full interview, click-on CNBC.
Tuesday, June 23, 2009
Updates on Specific ETFs and ETNs
Tomorrow is FOMC day! I can not imagine much will happen until the magical time of 2:15 EST. The dollar is still crucial going forward for my bearish thoughts on oil. Today was not a good day for the dollar. As measured by UUP, it was down 1.18%. I still believe the dollar has a little more on the upside, which would correspond to oil moving into oversold territory as measured by PPO, Stochastics, RSI, and CCI. The same statement can be made for the metals, gold and silver.
The following comments are updates on those ETFs and ETNs that I am currently following or have positions:
GLD ($90.92) -- Support is right at its 200-day EMA of $88. If dollar strengths, GLD will sell off towards support at $88.
GLL ($15.34) -- It is right at support. It's 50-day EMA is at $15.44, which has been resistance. In addition, it has moved into overbought territory as measured by PPO, Stochastics, RSI, and CCI. I have a small position in GLL, which I may decide to liquidate tomorrow morning.
SLV ($13.63) -- Silver has support at $13.50. PPO, Stochastics, RSI, and CCI are moving into oversold territory. If it can hold the $13.50, I may be tempted to purchase it with a price object near term of $17, which is a major overhead resistance zone.
ZSL ($9.11) -- Support is at $9. However, PPO, Stochastics, RSI, and CCI are all over bought at the current price. Near term, I am negative.
DTO ($76.69) -- This double-inverse oil ETF has been my favorite trading vehicle recently. I liquidated this position on Monday at an average price of $79.01 for a 10.8% profit. Depending on the dollar, I could see DTO trading at $90. It is still on my radar.
UNG ($14.48) -- I have small position in UNG, which was part of my paired trade with DTO. DTO leg was lifted at a profit. However, I decided to hold UNG. It has been trading right at its 50-day EMA for the past week. I still like UNG, because I believe it is cheap in relation to oil (USO:UNG). That is the price spread will work in the favor of UNG.
Summers for Bernanke as Fed Chairman?
Rumor has it that Larry Summers will replace Ben Bernanke as Fed Chairman when his term is up in January. Summers is Obama's Director of the National Economic Council (NEC). Further, the rumor on Wall Street is that Summers agreed to be Obama's Director of the NEC as long as Obama appointed him as Fed Chairman in January 2010. I don't have a problem with replacing Bernanke but NOT with Summers. Now, lets work on a replacement for Tim Geithner as Treasury Secretary.
Monday, June 22, 2009
DTO (Double-short Oil)
Those of you that track my Twitter account knew that I sold my positions early this morning for an average price of $79.01, which equates out to a 10.8% return.
It had a gap open of $4. From a technical perspective, it has not reached the overbought area as measured by Stochastics, PPO, RSI, and CCI. See the following chart. If it closes the gap, I just might be interested in trading it again.
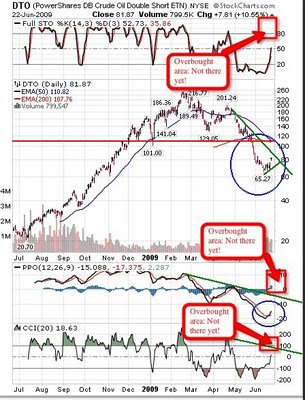 To enlarge the chart, double-click inside of it.
It had a gap open of $4. From a technical perspective, it has not reached the overbought area as measured by Stochastics, PPO, RSI, and CCI. See the following chart. If it closes the gap, I just might be interested in trading it again.
 To enlarge the chart, double-click inside of it.
Saturday, June 20, 2009
Congress and the International Monetary Fund (IMF)
This week in Washington the House approved $106 billion supplemental appropriations bill to fund our troops in Irag and Afghanistan, which also included $108 billion for the IMF. Umm! A vote against the IMF funding would be a vote against our troops. This should be an outrage to every American. These bills should be separate and voted as such. The argument that the Administration is putting forth is that it is in our vital economic interest and global security to fund the IMF $108 billion. Why? Is anyone really home out there?
It's not like the IMF doesn't have any financial resources. The IMF holds 3,217 metric tons of gold (103.4 million ounces).
Now, I am all for the funding of our troops, but I can not justify funding the IMF; which, by the way, is not such a great supporter of the United States.
This bill will now be voted on in the Senate. If you feel that funding for our troops and the IMF should be separate bills and debated on their own merits, contact your Senators and tell them as much!
S&P 500 Update for the Week Ending June 19, 2009
 Note: To enlarge chart, double-click inside of it.
Federal Open Market Committee (FOMC) meets next Wednesday. We could have volatility going into Wednesday; but, then again, that could be good for traders. However, I would settle for a trending market, either up or down. It would make one's investing life that much easier.
From an investing standpoint, that is the great benefit of using exponential moving averages (EMA), such as the 14-Week EMA and 40-Week EMA, to make investment decisions. Simply point, investors should be in stocks when the 15-Week EMA is above its 40-Week EMA; and of stocks and into money market instruments when the 15-Week EMA is below its 40-Week EMA. It doesn't get any more complicated than that.
Friday, June 19, 2009
Update on DTO
For those of you that follow me on Twitter, know that I have a position in DTO (double-inverse oil. I am in with an average cost of $71.31. DTO closed at $74.06. See my comments my comments in the following DTO chart: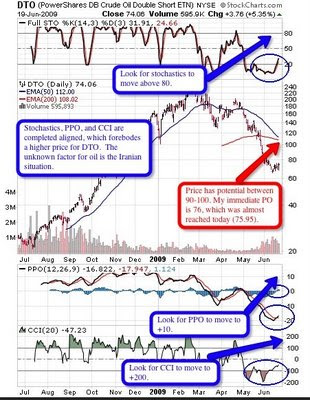
Note: To enlarge chart, double-click inside of it.
I will update my weekly S&P 500 comments over the weekend.

Note: To enlarge chart, double-click inside of it.
I will update my weekly S&P 500 comments over the weekend.
Washington is Wall Street and Wall Street is Washington
Please take the time to review the following video! It pretty much sums up my believe that the "Financial Oversight Bill" being proposed by the Fed is all about control that will further enhance the relationship between Washington and Wall Street. Main Street, you are screwed! Forgive my vulgarity, but how can we trust those individuals who put us in our current economic/financial debacle to come up with solutions to rectify the problem? Those individuals are the problem, not the solution.
Wednesday, June 17, 2009
Reflection on DTO (Double-short Oil) and USO (OIL)
I entered a trade on DTO today at $71.81 with a stop at $71.09, which turned out to be a very quick trade (loss of 1%). Saying that, I still like its potential. Please refer to the following chart for my rationale on entering the trade. On reflection, I would have done it again, because all the key technical indicators (stochastics, PPO, and CCI) were all in alignment.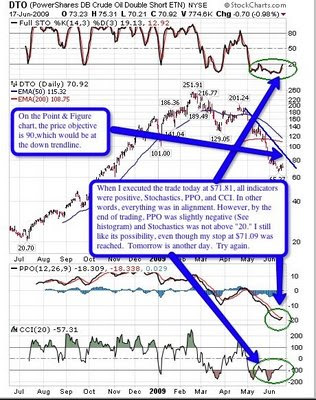 Now, take a look at USO, which is the mirror image of DTO, and tell me do you want to be long or short oil based on these two charts?
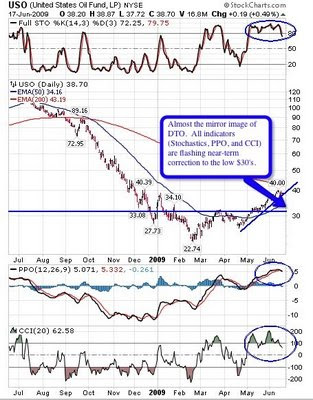
 Now, take a look at USO, which is the mirror image of DTO, and tell me do you want to be long or short oil based on these two charts?
Buy China Policy
The "Financial Times" reports today that "China has introduced an explicit “Buy Chinese” policy as part of its economic stimulus program in a move that will amplify tensions with trade partners and increase the likelihood of protectionism around the world. In an edict released jointly by nine government departments, Beijing said government procurement must use only Chinese products or services unless they were not available within the country or could not be bought on reasonable commercial or legal terms."
Anyone remember the names of Smoot and Hawley? If not, you probably better brush up on your history, especially after the government just announced that the CPI had biggest annual drop in nearly 60 years.
Anyone remember the names of Smoot and Hawley? If not, you probably better brush up on your history, especially after the government just announced that the CPI had biggest annual drop in nearly 60 years.
Obama's Iran Abdication to Sarkozy
"The President yesterday denounced the "extent of the fraud" and the "shocking" and "brutal" response of the Iranian regime to public demonstrations in Tehran these past four days. "These elections are an atrocity," he said. "If [Mahmoud] Ahmadinejad had made such progress since the last elections, if he won two-thirds of the vote, why such violence?" The statement named the regime as the cause of the outrage in Iran and, without meddling or picking favorites, stood up for Iranian democracy."
No, those words were not spoken by President Obama but France's President Nicolas Sarkozy. "The French are hardly known for their idealistic foreign policy and moral fortitude. Then again many global roles are reversing in the era of Obama."
For the complete text of the opinion expressed by the "Wall Street Journal," go to Obama's Iran Abdication.
Twitterrific
For those of you that have an "iPhone," you can follow my inter-day market updates by downloading a free application called "Twitterrific." It is a mobile Twitter. IMHO, it is a great application for the iphone.
Tuesday, June 16, 2009
ZSL: Ultra-short Silver
I sold my ZSL positions today for the reasons depicted in the following chart.
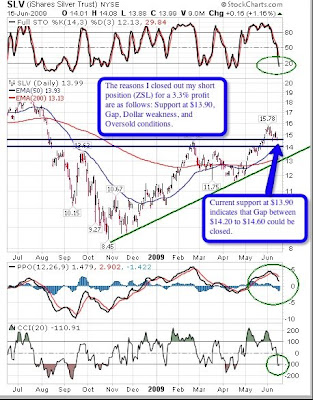 Note: To enlarge chart, double-click inside of it.
 Note: To enlarge chart, double-click inside of it.
Monday, June 15, 2009
DTO (Double-short Oil), UNG (Natural Gas), and ZSL (Double-short Silver)
I removed the DTO leg at $71.61 of the DTO:UNG paired-trade today. The trade netted 5% for a 24-hour investment. As I mentioned on Twitter, I may learn to regret removing the leg. Matter of fact, in after-hour trading, DTO closed at $72.24. UNG closed the day at $15.71, which was up 7%. I still like the natural gas story and its technical picture. The other trade from Friday was ZSL, which closed at $8.79 (+10%). (See the following chart on SLV.) To say the least, it was a good day. However, I realize what the market gives, it can take!
The main reason for selling DTO, besides the 5% gain, was due to the unrest with aftermath of the Iranian election situation. If this situation implodes within Iran, oil will definitely rally.
I still maintain these markets (equities, bonds, oil, and metals) are all tied directly to what happens to the dollar. Therefore, one must pay very close attention to what happens at the BRIS meetings tomorrow.
 Note: To enlarge, double-click inside the chart.
The American Empire is Bankrupt
Please read this very important article of the BRIS meetings being held today and tomorrow by Chris Hedges in the Truthdig. An excerpt from the article is as follows:
"There are meetings being held Monday and Tuesday in Yekaterinburg, Russia, (formerly Sverdlovsk) among Chinese President Hu Jintao, Russian President Dmitry Medvedev and other top officials of the six-nation Shanghai Cooperation Organization. The United States, which asked to attend, was denied admittance. Watch what happens there carefully. The gathering is, in the words of economist Michael Hudson, “the most important meeting of the 21st century so far.”
"It is the first formal step by our major trading partners to replace the dollar as the world’s reserve currency. If they succeed, the dollar will dramatically plummet in value, the cost of imports, including oil, will skyrocket, interest rates will climb and jobs will hemorrhage at a rate that will make the last few months look like boom times. State and federal services will be reduced or shut down for lack of funds. The United States will begin to resemble the Weimar Republic or Zimbabwe."
Now, you should understand why I thought the Federal Reserve and Treasury would do everything in their power to strengthen the dollar going into the BRIS sessions. Tomorrow and Wednesday could prove very interesting for the dollar (UUP). By the way, UUP closed up 1.83% today. That for any currency is one major move.
Extended Stay Hotels Seeks Chapter 11
Extended Stay Hotels, saddled with a huge debt burden from its $8 billion top-of-the-market buyout, filed for Chapter 11 protection Monday, in one of the largest bankruptcy filings by a commercial real-estate company.
I have been warning about the problems in the commercial real-estate area for the past six months. These toxic loans will have a very negative impact on "regional banks." Extended Stay Hotels is just the "tip-of-the-iceberg."
If you want to short the commercial real-estate sector, take a look at SRS, which is a double-short ETF on this sector. It is currently trading at $19.83, which is up 9% so far today. Upside potential is at its 200-day EMA at $28. If you take the trade, set your stop at two ticks below today's low of $18.63, or $18.61.
Twitter Comments
The following comments are from "Twitter:"

You can follow my inter-day comments by going to Twitter.

You can follow my inter-day comments by going to Twitter.
USO to UNG: Spread Trade
As mentioned on my Twitter (twitter.com/debauche), here are the details of this paired trade:
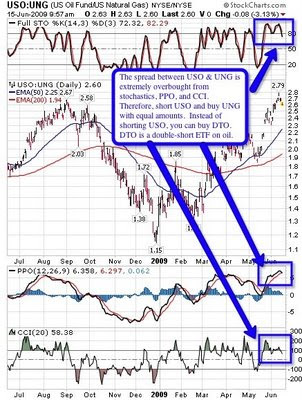
Since the vehicle of choice is DTO, double-short oil, purchase 10 shares of UNG for each DTO. Let's see what happens.

Since the vehicle of choice is DTO, double-short oil, purchase 10 shares of UNG for each DTO. Let's see what happens.
S&P 500 Weekly Update for June 12, 2009

Note: To enlarge chart, double-click inside of it.
Keep-in-mind that this is OPX option expiration week. Therefore, expect volatility! Also, the dollar's direction will determine the short-term direction for the equities, metals, and oil. That is, higher dollar, lower equities, metals, and oil.
Friday, June 12, 2009
ZSL: Ultra-short Silver
The inverse relationship between the dollar and metals (gold and silver) is playing out today. If ZSL can say above it opening price of $7.91, it can be purchased. I would rather buy ZSL than GLL. If executed, place a stop at $7.30. Upside potential for ZSL is $9.70. Overall, this is a high-risk trade.
Silver (SLV) has the potential of selling-off to $13.40-$13.90, which would be extremely positive for ZSL.
Silver (SLV) has the potential of selling-off to $13.40-$13.90, which would be extremely positive for ZSL.
House Representatives Personal Financial Disclosures
If you want to find out what your Representative disclosed in his/her financial report to Congress, check out Legistorm. Great site!
Thursday, June 11, 2009
No Executions Today on GLL and ZSL
Criteria were not met again today to take positions in GLL and ZSL. Let's see what tomorrow brings. This trade is tied directly to a stronger dollar, which would be negative for gold, oil, and silver. Long term, I am bullish on the metals and oil. Near term, I do see weakness in the metals and oil, not only because I believe the dollar will strengthen, but the metals and oil are very overbought at their respective current price levels. Could I be wrong? You bet. It would not be the first time. But I would definitely be caution near-term investing in metals and oil.
Once again, if you have a Twitter account, you can follow my inter-day updates there, especially as we approach the close.
Once again, if you have a Twitter account, you can follow my inter-day updates there, especially as we approach the close.
Today's Setup for GLL and ZSL
No execution yesterday for GLL (double inverse gold) and ZSL(double inverse silver). Both closed exactly at Tuesday's close. For today, purchase GLL and ZSL if today's close is above their open and yesterday's close (GLL @ $14.49 and ZSL @ $7.63). Enter orders only if the price going into the close (last five minutes) is above today's open and yesterday's close.
If you want an update going into the close each day, I will Twitter what I am doing. Therefore, if you have a Twitter account, you can follow me. If you don't have a Twitter account, you may want to join.
If you want an update going into the close each day, I will Twitter what I am doing. Therefore, if you have a Twitter account, you can follow me. If you don't have a Twitter account, you may want to join.
Wednesday, June 10, 2009
GLL and ZSL
No execution occurred yesterday for GLL and ZSL. GLL and ZSL closed yesterday at $14.49 and $7.63, respectively. For today, purchase GLL and ZSL if today's close is above their open and close going into the close of the day. (These orders are suppose to be entered during the last five minutes of trading.) Therefore, review price status, as indicated above, during the last thirty minutes of trading but only enter orders if the price going into the close (last five minutes) is above today's open and yesterday's close.
Tuesday, June 09, 2009
Spam Blog
I have been notified by "Blogger" that my blog is suspect of being a possible spam blog. You got to be kidding me! Therefore, those of you who have been receiving email updates of new posts will not be receiving any further such notifications.

Update on Euro Versus Dollar
 Note: To enlarge the chart, double-click inside of it.
The following two charts are GLL and ZSV, which are double-inverse bearish ETFs. These ETFs should move higher as the dollar continues to strengthen in relation to the Euro.


Thursday, June 04, 2009
EURO vs. Dollar: Near Term Impact for Gold, Oil, Silver, and Stocks

Note: To enlarge the chart, double-click inside.
Wednesday, June 03, 2009
President Obama: United States is one of the largest Muslim countries in the world!
In an interview with France's Canal Plus Television that was released on Tuesday evening, President Obama suggested that the United States might be a Muslim country. (You can read the entire transcript at Canal Plus Television.)
Wait a minute! Does anyone in the media take the time to check Obama's facts or do they simply accept his facts as gospel? The U.S. in fact has less than 1% of the world’s Muslim population of an estimated 1 billion people. The top 50 Muslim nations by percentage is here (with Muslim population figures), and the United States is not even close to being a Muslim country, let alone close to being anywhere near the top 50.
With an estimated 5 million to 8 million Muslims, Muslims are less than 3% of the U.S. population. By sheer number, the United States is far behind Indonesia (213 million), Pakistan (156 million), and Bangladesh (127 million). And, at least 23 nations have more Muslims.
Tuesday, June 02, 2009
Ethanol's Exorbitant Cost
The "Wall Street Journal" reported today (page A11) that "The Obama Administration is pushing a big expansion in ethanol, including a mandate to increase the share of the corn-based fuel required in gasoline to 15% from 10%. Apparently no one in the Administration has read a pair of new studies, one from its own EPA, that expose ethanol as a bad deal for consumers with little environmental benefit.
The biofuels industry already receives a 45 cent tax credit for every gallon of ethanol produced, or about $3 billion a year. Meanwhile, import tariffs of 54 cents a gallon and an ad valorem tariff of four to seven cents a gallon keep out sugar-based ethanol from Brazil and the Caribbean. The federal 10% blending requirement insures a market for ethanol whether consumers want it or not -- a market Congress has mandated will double to 20.5 billion gallons in 2015.
The Congressional Budget Office reported last month that Americans pay another surcharge for ethanol in higher food prices. CBO estimates that from April 2007 to April 2008 "the increased use of ethanol accounted for about 10 percent to 15 percent of the rise in food prices." Ethanol raises food prices because millions of acres of farmland and three billion bushels of corn were diverted to ethanol from food production. Americans spend about $1.1 trillion a year on food, so in 2007 the ethanol subsidy cost families between $5.5 billion and $8.8 billion in higher grocery bills."
Readers, this is governmental absurdity. Now, I want you to visualize an America whereby the government is producing cars (Government Motors, formally General Motors), making mortgages (Fannie Mae and Freddie Mac), and running our health care systems and along with managing our postal system and Amtrak. I, for one, don't like that picture.
Obama's New Deal is Really Roosevelt's "Old" New Deal
I had posted this several months ago, but I thought a little bit of redundancy is always a good technique to solidify one's learning.
Roosevelt's Treasury Secretary, Henry Morgenthau, angry at the Keynesian spenders, wrote in is his diary May 1939: "We have tried spending money. We are spending more than we have ever spent before and it does not work. And I have just one interest, and now if I am wrong somebody else can have my job. I want to see this country prosper. I want to see people get a job. I want to see people get enough to eat. We have never made good on our promises. I say after eight years of this administration, we have just as much unemployment as when we started. And enormous debt to boot."
Roosevelt's Treasury Secretary, Henry Morgenthau, angry at the Keynesian spenders, wrote in is his diary May 1939: "We have tried spending money. We are spending more than we have ever spent before and it does not work. And I have just one interest, and now if I am wrong somebody else can have my job. I want to see this country prosper. I want to see people get a job. I want to see people get enough to eat. We have never made good on our promises. I say after eight years of this administration, we have just as much unemployment as when we started. And enormous debt to boot."
Weekly Update: S&P 500 and Dollar-debased Index

Dollar-debased Fund was up 1.4% for the week. The big winner was DXO, which was up 14%, and the big loser for the week was SDS, which was down 8%. You might want to go back and review the Dollar-debased Fund from the posting of May 25, 2009.

Subscribe to:
Comments (Atom)