Think of free cash flow (FCF) as another bottom line. Negative free cash flow isn't necessarily bad, but it suggests you're dealing with either a speculative investment or an underperformer. Above all, negative free cash flow usually equates to a high level of capital spending that naturally raises other questions. If the company is spending so much money on capital projects, is it at least earning a high return on that capital? Is the company’s IRR > WACC? And is all that spending paying off in rapid sales and profit growth?
The relevancy of free cash flow is that it represents “real cash,” earnings do not.
Calculation for free cash flow is as follows:
1. FCF = NOPAT – Net Investment in Operating Capital
a. NOPAT = EBIT(1-Tax Rate)
b. Net Investment in Operating Capital = [Cash + Accounts Receivable + Inventories – (Accounts Payable + Accruals)] (Net Operating Working Capital) + Operating Long-term Assets (Net Plant and Equipment)
2. FCF = (NOPAT + Depreciation) – Gross Investment in Operating Capital
a. NOPAT = EBIT(1-Tax Rate)
b. Gross Investment in Operating Capital = [(Net Operating Working Capital + Operating Long-term Assets) + (Depreciation)]
Uses of FCF
1. Pay interest to debt-holders
2. Repay debt-holders
3. Pay dividends to shareholders
4. Repurchase stock from shareholders
5. Purchase marketable securities or other non-operating assets
Wednesday, February 21, 2007
MBA 642 Financial Management: Million Dollar Challenge!
Next Tuesday, February 27, I am going to have Dr. Oglesby place the class into teams. Each team will select a facilitator and proceed to register for the "Million Dollar Portfolio Challenge" that is being sponsored by CNBC. I thought this would be a great way to see if any of you can win the million dollars. Thanks to Daniel Webster for bringing this to my attention.
Once the facilitator is selected, he or shee will register his/her team on CNBC for the “Portfolio Challenge.” See instruction below. I will the computer lab open so that each group can start the million dollar process. Good luck!
1. Go to CNBC (http://www.cnbc.com)
2. Click-on “Investing Tool.”
3. Click-on “Portfolio Challenge” to register.
4. Complete the registration procedure.
5. Challenge starts March 5, 2007
Stock Market Rallies
As we start to look at the various stock valuation models, it is always a good ideal to reflect upon where the market is today in relation to its performance and length of its current bullish trend.
As the following chart indicates, the current bullish rally is approximately 4.5 years in duration, which is long by previous market rallies. In addition, its current performance during this rally is approximately +75% over the past 4.5 years, which is lags behind previous market rallies. Also, the current rally is below its linear-regression trend line. Will we have a revision to the mean (point on the line) or will this market rally continue to underperform?

As the following chart indicates, the current bullish rally is approximately 4.5 years in duration, which is long by previous market rallies. In addition, its current performance during this rally is approximately +75% over the past 4.5 years, which is lags behind previous market rallies. Also, the current rally is below its linear-regression trend line. Will we have a revision to the mean (point on the line) or will this market rally continue to underperform?

Monday, February 05, 2007
Fama and French Three-Factor (Predictor) Model
CAPM uses a single factor, beta, to compare a portfolio with the market. Why use more factors (predictors)?
Fama and French started with the observation that two classes of stocks have tended to do better than the market as a whole: (1) small caps [SML] and (2) stocks with a high book-value-to-price ratio [HML]. When they tested their hypothesis, they found small companies and companies with high B/M ratios had higher rates of return than the average stock (just as they hypothesized). Somewhat surprising by their research, however, they found no relation between beta and return.
They added two additional factors (predictors) to CAPM to reflect a portfolio’s exposure to size and B/M. The three-factor model is as follows:
ri = rf + bi(MRP) + ci(SMB) + di(HML) + alpha
One thing that is interesting is that Fama and French still see high returns as a reward for taking on high risk. For example, if returns increase with B/M, then stocks with high B/M ratio must be more risky than low B/M. Why?
Buy, Hold, or Sell
From the following weekly chart of IWO, determine the relationship between and among Commodity Channel Index (CCI), Full Stochastics, and Percentage Price Oscillator (PPO) in relation to forecasting the price direction of the underlying security?


OER or It's All About Data Analysis
From your analysis of the article (Manning the OER), which will be handed out in class, why are intermediate (10 year) and long (30 year) Treasuries not rallying in the face of “OER’s” weakness? Also, the Fed’s target for core inflation is between 1% and 2%. What is the current core inflation rate? In addition, what is the prospect for the core inflation rate during 2007?
Sunday, February 04, 2007
January Indicator of Future Stock Performance
As goes January, so goes the year. This particular phenomenon is what is referred to as the “January Barometer.” The following chart, which is from “Chart of the Day.com,” presents the average performance of the S&P 500 one, three, six, and 11 months following a January gain (blue bars) and following a January loss (gray bars). The chart illustrates that the S&P 500 has performed much better (on average) during the months following a January gain. In fact, 11 months following a January gain; the S&P 500 was up 89% of the time. For January 2007, the S&P 500 was up 1.4%.


The "January Indicator" has an impressive record. Does the indicator imply that since the market was up in January that eleven months from now the S&P 500 will rise over 12%? Evaluate the aforementioned question. In your evaluation, what type of information would you want to know?
Saturday, January 13, 2007
Declining CRB Index Signifies Economic Weakness
In their latest weekly update, Comstock Partners, Inc. provided an interesting analysis of their findings of the recent decline in the "CRB Index." Quote:
"The idea that falling crude oil prices will boost the economy and overcome the plunge in housing is yet another instance of hope replacing reality. Despite its great importance, oil is just another commodity that goes up and down with the business cycle. When the economy begins to weaken commodity prices go down; when the economy is strong commodity prices go up.
Since its May high the CRB commodity index has dropped 22%, only the 7th time this has happened since 1974. According to ISI, since 1974 every decline in the index of 20% or more has been associated with either a recession, a significant slowdown or a financial crisis. Each of these periods has also occurred following a period of tight money and an inverted yield curve. In this regard it is also noteworthy that oil has not been the only commodity declining in price. Recent months have featured significant declines in a wide assortment of commodities such as copper, gold, sugar, hogs, wheat and corn. It is therefore likely that the oil price decline is itself a result of economic softening rather than an impetus to growth.
ISI also points out a number of other factors historically associated with significant economic slowdowns including the lagged effect of 17 rate hikes; the decline of house prices; the plunge in mortgage equity withdrawals (MEW); the inverted yield curve; significant slowing in the leading indicators; tightening by foreign central banks; and nominal GDP growth under the fed funds rate.
Source: http://www.comstockfunds.com
Friday, December 01, 2006
The Economy
The "Big Picture" had an interesting perspective on the economy, which is provided as follows:
"On CNBC, the pundits are talking about how the most recent spate of data has put Goldilocks scenario in danger. I must admit to finding it amusing how much faith so many players had put into Goldilocks, a most unusual and unlikely scenario.
The latest data forces me to revise my 50% possibility of a recession in 2007/08 up to 60%. GDP for Q4 '06 is likely to be between 0.5% - 1.5% (or worse, if Holiday sales keep trending softer).
As far as the Fed, this data suggests that the jawboning about inflation will remain just that -- while we still expect the Fed to cut before 2007 comes to an end, the odds of a hike anytime soon have just dropped significantly.

Inventory build, government spending and imports, was responsible for virtually all of the 0.6% upward revision in GDP. Consumption, 70% of the US economy, is slowing.Revised higher:
Government spending (0.05%)
Inventory Build (0.26%)
Imports (0.39%)
Revised lower:
Exports were revised 0.2% lower.Consumption was revised 0.14% lower
Why are Businesses inventories increasing? Some pundits have claimed this is a bullish sign, an "anticipation of increased demand." I doubt this. We have seen recent CEO surveys which point to major negative sentiment amongst the usually cheery Execs; Durable Goods tumbled 8%, and Housing and Autos are likely already in a recession. My guess is that Just-in-time-inventory is easier to ramp than it is to slow down.
And while Reuters reported that "Business spending on inventories rose, increasing sharply to a $58 billion rate from the $50.7 billion earlier estimated." Inventories builds have increased at a faster than usual pace -- implying that this was (whoops!) unintentional.
Given the drop in both Durables and Capex, I am somewhat incredulous over Business spending being revised upward to show a 7.2% gain (versus 6.4% advance)."
Source: http://bigpicture.typepad.comSaturday, November 25, 2006
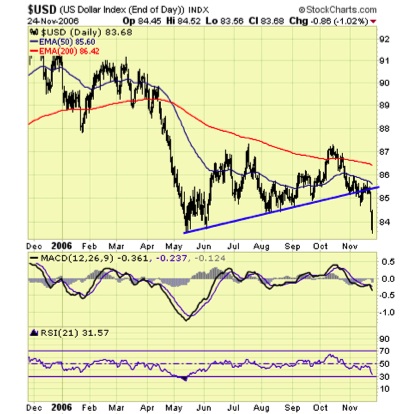
Determination of Exchange Rates
The following chart illustrates the "plummeting $."

What is going on with the extreme weakness in the dollar (at a 19-month low)? What is causing the $USD to be so weak? From Chapter 21, which is entitled International Financial Management, we can make an inference as to the recent $USD weakness. Read pages 603-611 that provide insight for each of the following exchange rate determinates of the $USD: Income and taste, Changes in relative interest rates, Changes in relative price levels, Changes in fiscal and monetary policies, Changes in Balance of Payments, and Other Factors such as Oil Prices and SOX or SarbOX Act.
For Tuesday, October 28, be ready to discuss the causes for the $USD weakness.
Saturday, November 11, 2006
Yield Curve Says "Probable" 2007 Recession
John Mauldin notes:
"The yield curve became more inverted this week, with the negative differential between the 3-month and the 10-year at -49 basis points and a -76 basis point differential between the 10-year and the Feds fund rate. According to a Fed paper, that level of an inversion suggests there is now an over 40% probability of recession next year. This same model only predicted a 50% chance of recession in 2000, and as the paper authors acknowledge, the model probably understates risk in recent decades."
The yield curve and interest-rate data looks like this, which is from Bloomberg.com:

Source:
John Mauldin
Investor Insight, November 10, 2006
http://www.frontlinethoughts.com/article.asp?id=mwo111006
Thursday, November 02, 2006
Free Cash Flow (FCF)
"Free Cash Flow (FCF)" represents the cash that a firm is able to generate after expending all the money to maintain/expand its assest base. In addition, investors like firms that produce lots of FCF; because it allows a firm to purse investment opportunities that enhance shareholders' wealth.
To calculate FCF, go to a firm's cash flow statement. There you will find the line item entitled "Total Cash Flow From Operating Activities." From this number, subtract the number from 'Capital Expenditure," which is found in the next section of the Cash Flow statement entitled "Investing Activites."
For your firm, calculate the FCF for the past three fiscal/calendar years and trend the data. What is the trend? Keep-in-mind that a negative FCF is not necessary bad. It could be the result of some large capital expenditures, which in itself could prove to be highly profitable.
Thursday, October 26, 2006
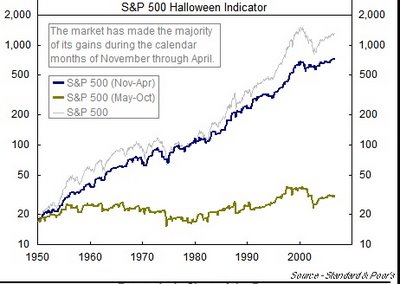
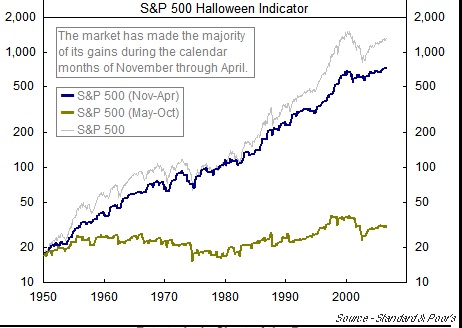
Halloween Indicator
The stock market is now entering what has historically been the strongest half of the year. The following chart, which is from "Chart of the Day," illustrates that investing in the S&P 500 from the last trading day in October, which is why it is referred to as the Halloween indicator, through the end of April accounted for the vast majority of S&P 500 gains since 1950. While there are some noteworthy periods in which the Halloween indicator didn't produce (i.e. 1973-74 & 2000-01), the overall performance is compelling. Therefore, on Tuesday, October 31, buy the S&P 500 Index and hold it until the last trading day of April, which is the 30. Place the proceeds in a "Money Market Account" until the last trading day in October 2007. Perfect formula for worry-free investing. And who said that investing is difficult. Trick or treat, anyone!
Wednesday, October 25, 2006
Saturday, October 21, 2006
History Lesson
"Stock prices have reached what looks like a permanently high plateau. I do not feel there will be soon if ever a 50 or 60 point break from present levels, such as they have predicted. I expect to see the stock market a good deal higher within a few months." - Dr. Irving Fisher, Professor of Economics at Yale University, one of the most important US economists of his day, speaking on October 17, 1929, a few weeks before the Great Crash.
Thursday, October 19, 2006
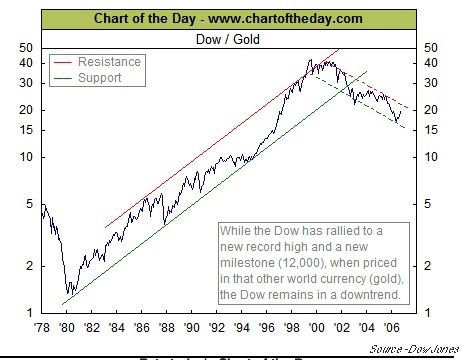
All Time High for the DJIA, or Is It?
The DJIA has moved over 12,000 in terms of dollars; but in terms of gold, it remains in a very well-defined "bear market." See the following chart.
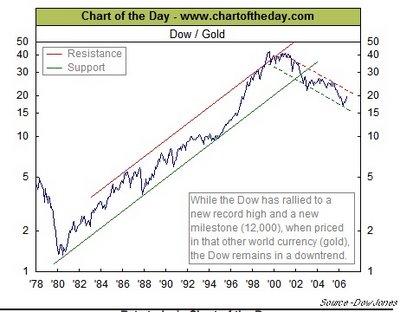 May be we should be purchasing gold, like GLD or GDX, and not equity stocks. What do you think? Make your comments during the coming week.
Saturday, October 07, 2006
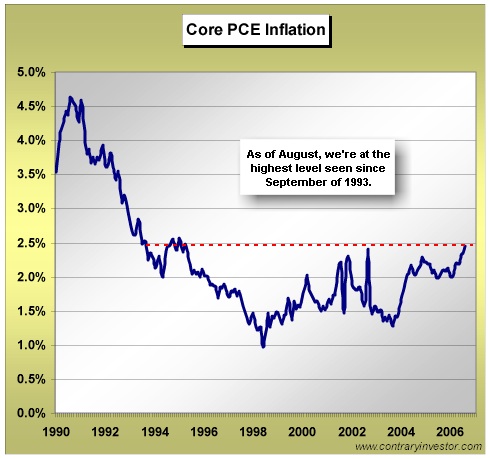
Goldilocks' Rally?
Core Personal Consumption Expenditures (PCE) inflation is the Fed's favorite gauge of measuring price inflation, which went to a high not seen in 13 years, well above the stated Fed comfort zone near the 2% ceiling. See the following chart that is from the Contrary Investor's report of October 3, 2006:

The reason that I present this chart is because the stock market is indeed anticipating that the Fed will soon be reducing its "Fed Funds" rate (January or March) with the market making a "new" this past week. In addition, the rate on the Ten Year TSY (4.75%) is below the Fed Funds rate (5.25%), which in the past has been an excellent harbinger of lower rates. Go to Bloomberg at http://www.bloomberg.com/markets/rates/index.html to see the current interest rate structures. Also, the decline in energy prices, especially oil and natural gas, along with the expectations that corporate earnings for the third quarter are going to be very robust have helped propel the market higher. But, the stock market has completely ignored the recent inflationary comments by several Federal Reserve members, which does not bode well for a cut in interest rates, along with signs that the economy is slowing, as discussed in last week's post.
On Tuesday, Fed Vice Chairperson Donald Kohn stated that he is more concerned about inflation than slowing economic growth because a recession is unlikely. On Thursday, Charles Plosser, Federal Reserve Chairperson of the Federal Reserve Bank of Philadelphia, stated that the Fed's very credibility was at stake when it came to keeping prices under control. He was clearly concerned that the core PCE inflation is above 2%, and he expressed the need to raise the Fed Funds rate, not lower it. Please remember that he, who has the gold, in this case the money, makes all the rules! And the Fed has all the money, therefore, it makes all the rules as it pertains to the financial markets and the economy. Therefore, don't count on the Fed reducing rates unless inflation, as measured by the PCE, comes down below 2%.
Monday, October 02, 2006
Risk-adjusted Rate of Return (Beta Analysis)
You just justed received your annual performance statement from your investment advisor. The statement indicates thaty your portfolio return for the past year was up 12%. In addition, you noticed within the statement that the S&P 500 rose 10%. Also, the statement gave the portfolio's beta, which means nothing to you, was 1.8. Further on, you read that the TSY Bill rate for the time period was 4.75%. To your dismay, the statement did not provide any further explanation. Therefore, you decide to call your investment advisor for clarification on what this all means. As an investment advisor, what is your response to your client? As the client, are your happy with the performance of the portfolio?
Friday, September 29, 2006
Wednesday, September 27, 2006
Be Forewarded!
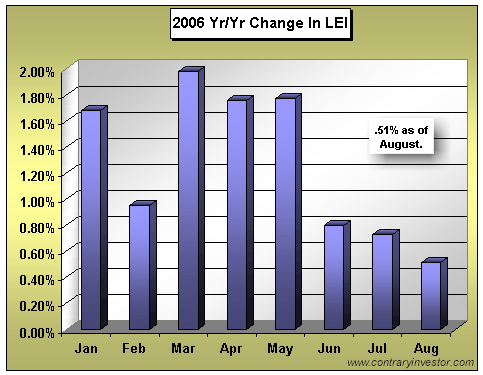
According to ContraryInvestor, every time over the last fifty (50) years that the year over year rate of change in the Leading Economic Indicators (LEI) dropped below 0.5%, either an outright "recession or a meaningful economic slowdown" has occurred. Wow! That is an excellent track record. By the way, the August 2006 LEI rate of change was 0.51%. I will definitely monitor the year over year rate of change for the LEI. The following chart, which is from the ContraryInvestor, illustrates the LEI for 2006 through August.
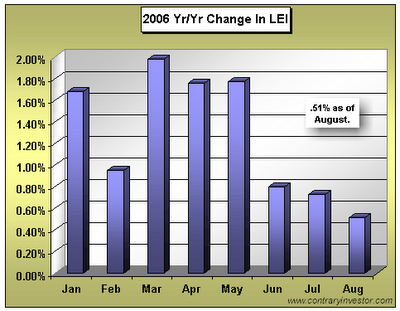 If one combines the track record of the LEI with the current negative to flat Yield Curve, a 2007 slowdown of significance definitely looms on the economic horizon. The probability will increase if the September 2006 LEI comes in under 0.50%, and the Yield Curve remains flat to negative.
Subscribe to:
Posts (Atom)