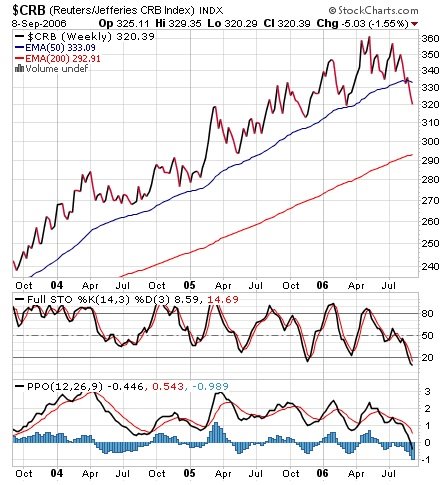
CRB Index has penetrated its 50-week EMA average, which does signal an end to its five-year major trend. However, since the 50-week EMA is above the 200-week EMA, the commodity bull market is still intact. What we can expect is a "correction" down to the 200-week EMA, which is currently about 300. Ok, what does this chart have to do with the price of oil? Everything. Take a look at the following $WTIC chart, which is the "Light Crude Oil."
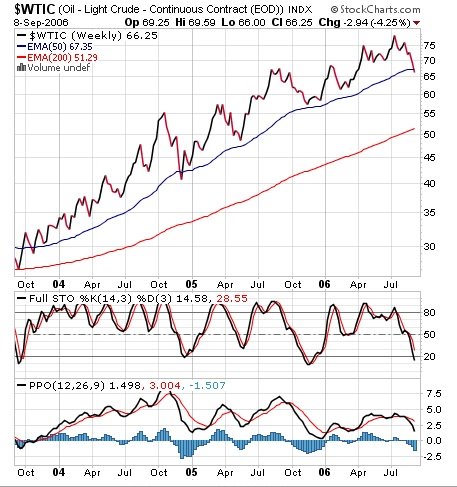
The price ($67.15) has penetrated its 50-week EMA ($67.39). $WTIC is following the price action of $CRB. Like the $CRB, $WTIC is still in a major bull market. Therefore, a reasonable downside price objective for oil is at the 200-week EMA, which is $51. By the way, that should equate to about $1.70 at the pump and still leave the major oil bull market intact.
You may have noticed that the two charts include some additional information (PPO and Full Sto) besides the "price." We will discuss these market indicators next week. In the meantime, enjoy these gas prices!
No comments:
Post a Comment