I thought it would be a good time to revisit
the price of
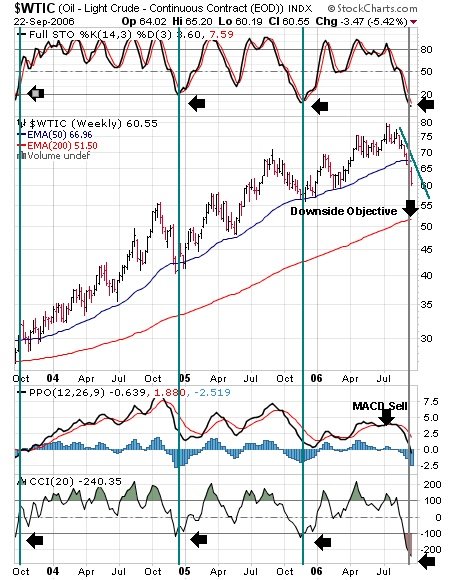
oil from the "post" of September 9. Since then, oil has declined approximately 9% to close Friday at $60.55. My analysis, at that time, projected that the price of oil would decline to its 200-week EMA, which is $51.50; and the price of gasoline at the pumps would be approximately $1.70. Has that analysis changed? Let's look at the following chart, which is WTIC as of Friday, September 22, before I give you my updated analysis.
First, look at the top portion of the chart that is entitled "Full Sto," which is a Stochastic Oscillator. I want to draw you attention to the
"arrows" on the oscillator. Notice that the level of the oscillator at each arrow reads
"20 or lower." Subsequently, the price of oil rose and in some cases, significantly. Second, look at the bottom portion of the chart that is entitled "CCI," which is the Commodity Channel Index. As before, isolate on the
"arrows" and notice that the levels were "-100 to -200" and the subsequent price rise. The Stochastic Oscillator and Commodity Channel Index measure short-term levels of being "overbought or oversold." Therefore, given the current, extremely, oversold readings, oil prices should move higher in the near term. Probably, oil could rise back to its 50-week EMA and the downward sloping resistance line, which is $66 or about 7%. If the $66 level is not significantly penetrated, oil should continue its price decline to the $51 level. Once again, this analysis is based on current world conditions. If the "geo-political" environment deteriorates, all "bets" are off. In the meantime, enjoy these gasoline prices. By the way, I paid $1.99 today to fill by Yamaha Waverunner.
For Tuesday, apply the Stochastic Oscillator and Commodity Channel Index to your stock and indicate if the stock is "overbought or oversold."
No comments:
Post a Comment