Over the twelve plus year period the 50- and 200-day EMA lines have crossed four times. Once in 1998, the 50-day EMA briefly pierced the 200-day EMA to the downside, suggesting a move into bear territory. The next cross to the downside was seen in late 2000 (dot.com debacle), warning of an equity market plunging into its largest and most extended bearish episode in many years. It was not until May of 2003 that the 50-day EMA crossed back up through the 200-day EMA. And, in January 2008, we have seen a cross to the downside. Until the 50-day EMA moves back up above the 200-day EMA, my position is to assume a defense investment position, such as being invested in a money market fund and/or inverse ETFs like DOG, SDS, DXD, and QID. Also, had one followed this very simple indicator over time, one’s financial health could have been greatly enhanced.
The focus of the blog is on the economic and financial uncertainties that the world economies will face over the next five years along with demonstrating how investors can profit and survive during the upcoming manipulated economic chaos. Please keep-in-mind that I don't provide investment advice. I am simply posting what my investment views of the market happen to be. Your investment decisions are solely your own responsibility.
Saturday, May 03, 2008
It's Not Over Until It's Over
Over the twelve plus year period the 50- and 200-day EMA lines have crossed four times. Once in 1998, the 50-day EMA briefly pierced the 200-day EMA to the downside, suggesting a move into bear territory. The next cross to the downside was seen in late 2000 (dot.com debacle), warning of an equity market plunging into its largest and most extended bearish episode in many years. It was not until May of 2003 that the 50-day EMA crossed back up through the 200-day EMA. And, in January 2008, we have seen a cross to the downside. Until the 50-day EMA moves back up above the 200-day EMA, my position is to assume a defense investment position, such as being invested in a money market fund and/or inverse ETFs like DOG, SDS, DXD, and QID. Also, had one followed this very simple indicator over time, one’s financial health could have been greatly enhanced.
Thursday, May 01, 2008
Double Your Pleasure or Double Your Pain

Since January 2008, my position has been that the market is either in a major correction or the start of a "Bear Market." Therefore, I thought it was about time to revisit that position.
Monday, March 17, 2008
Assurance from President Bush
The Impudent Boldness of Greenspan
Monday, March 10, 2008
Market Update
Monday, February 18, 2008
Double Jeopardy
Source: Contrary Investor
Tuesday, February 12, 2008
Çredit Crisis: Precursor of Great Inflation
Thursday, February 07, 2008
Bear Market Rallies
Monday, February 04, 2008
Tuesday, January 29, 2008
The Great Fiscal Stimulus Package of 1929
Tuesday, January 22, 2008
Saturday, January 19, 2008
The Market Has Spoken!
Since the market is extremely oversold, we should expect the market to rally short-term. Keep-in-mind that this is not a time to me looking for a major bottom. Don't get sucked in by those pundits who will be screaming that this is a golden opportunity to buy. Prepare yourself mentally to either short the market or purchase inverse ETFs, like SDS. The best chance for the market to make some kind of a bottom, based on market cycles, is around March 27, 2008.
Source: Jack Chan's "Simply Profits"
Wednesday, January 16, 2008
Inflation Jumps in 2007
Tuesday, January 15, 2008
Market: Critical Junction
Investment Trend
Wednesday, October 31, 2007
S&P 500 Index: Home Building vs. Department Stores
Source: The Big Picture
Tuesday, October 30, 2007
Today's FOMC Meeting
Today, the Fed will cut the Fed Funds rate by 25 basis points. At least this is the betting line over at the Chicago Board of Trade. 98% of the traders are pricing in a 25 basis point cut, while only 8% are pricing in a 50 basis point cut. I am firmly in the camp of another rate cut, because our credit problems (subprime mortgages and SIV's) are still with us.
The importance today is not the Fed's action but the reaction of the markets, currency and equity. Rates cuts are generally considered bullish for the equity market, except when a recession is looming on the economic horizon. Thanks to the Contrary Investor for providing the following insight on the rates cuts that preceded the previous recession.
Learning point is that not all rate cuts are bullish, but rather the key is the reaction of the financial markets to any change in monetary policy.
Friday, October 05, 2007
Washington Mutual's Earnings To Suffer From Mortgage Woes
Thursday, October 04, 2007
Technical Analysis: Would You Purchase this Stock?
Answer: In your response, indicate the reason for your decision. [There is neither a right or wrong answer.]
Monday, October 01, 2007
Dollar Strategy
Wednesday, September 26, 2007
What is the Dollar Worth?
Since the Fed cut the Fed Funds rate, it seems every currency, inclusive of Third World currencies, in the world has rallied against the dollar. The Euro is at an all time high, recently the dollar was trading at $1.412 to the Euro. Even the Canadian dollar (loonie) is now at par against the dollar, which is the first time in three decades. However, take solace, the dollar did hold its own against the Zimbabwean dollar where inflation in that country is only running at 15,000% a year.
In addition to the dollar's weakness against currencies in general, the price of oil exceeded $84 a barrel; and with the prospects of reflation, the price of gold went to $740.
Don't worry. The Fed has everything under control. Just look at how well they have protected the value of the dollar.
Tuesday, September 18, 2007
August Wholesale Prices Fall Sharply (What about core inflation?)
The reason that I posted this information is to inform you that the market will do anything to justify a rate cut by the Fed. The whole emphasis in today's financial press is on the decline of wholesale prices, which in effect is saying that inflation at the wholesale level is in check. Therefore, the Fed can go ahead and cut interest rates. However, what is completely ignored is the fact that just a month ago the emphasis by the financial media was on "core inflation." And, if you noticed the last sentence in the first paragraph, you read that core inflation rose .2%, which on an annual basis is 2.4%. This was double from the previous month. The Fed generally would like the core inflation to be between 1% and 2%.
Will the Fed cut the Fed Funds rate? You bet! Will the equity markets be satisfied? Probably not. That is why the old Wall Street adage will probably be true, which is "Buy the rumor and sell the news."
Thursday, September 13, 2007
Root Causes of Financial Bubbles
Another question to ask is why and when did the Federal Reserve increase reserves to the banks? The Fed started its current monetary expansion program after the last recession, 2002. The Fed realized that since the consumer is such an important component of GDP, something like 71%, it needed a catalyst to stimulate the economy. The consumer was that catalyst. By providing and injecting reserves to the banking system, the Fed knew that the desired outcome of GDP growth would occur through the assistance of the banking system and individual borrowers. However, this contrived real estate bubble has finally burst, as all bubbles do, and the consequences are going to be felt for many years to come. The Fed's solution will be to simply reinflate the economy and create another bubble.
What I find interesting about this current subprime mess is that no one or a very small fraction of the financial world is looking at the Fed as the real culprit or villain. However, I do hear that the subprime mess is the fault of mortgage banks, credit agencies, and hedge funds. But I firmly believe that these entities are not the "root" cause of the problem. For that, simply look at the Federal Reserve and its expansionary monetary policies.
By the way, the chart from my post of September 3, which was entitled, “Picture is Worth a Thousand Words,” is that of the Money Supply. The chart can be accessed at the following URL: http://research.stlouisfed.org/fred2/series/MZMNS.
Saturday, September 08, 2007
The Next Subprime Mess
These investment vehicles are entities that banks use to issue commercial paper, which is a money market instrument. With the proceeds, banks purchase corporate receivables, auto loans, credit card debt, and, yes, mortgages. Why is this so alarming? Take Citigroup, for example. Citigroup owns about 25% of the market for SIVs, which is approximately $100 billion according to the "Wall Street Journal" in its September 5, 2007 edition. Yet, in its 2006 filing with the SEC, there is no mention of it. What? How can this be? Well, accounting rules don't require banks to separately record these type of off-balance sheet investment vehicle on their main financial statements. One would have thought that the accounting profession would have learned something from Enron, World Com, and Global Crossing. The demise of each of these companies was directly tied to off-balance sheet vehicles.
The Federal Reserve System has a major challenge ahead of itself in trying to bring stability and trust back to the financial markets. In my opinion, these challenges are a direct result of their own polices instituted during the past five years. The banks and financial markets did not create this subprime mess or pending SIV mess. The Fed did that all by themselves. The banks and financial markets were just reacting to what the Fed was doing. That is, when the Fed reinflated the banking system with reserves (money), banks made loans. Because interest rates were low, which was caused by the Fed reinflating the banking system, individuals were more than happy to refinance their homes and draw down their home equity. This resulted in real GDP growth. However, the consequence of all this liquidity has been the inflation of all financial assets. Like all bubbles, they do burst; and we have already seen the subprime bubble burst. The next one just could be those nasty SIVs.
Monday, September 03, 2007
Picture is Worth a Thousand Words
What is the name the above chart?
Thursday, August 30, 2007
Did Someone Say, Volatility?
This market is just waiting for Bernanke and friends to make of their minds on what to do about the Fed Funds rate. First, the discount rate was cut to 5.75%, which did calm the markets somewhat. However, you can not tell that by the past Tuesday and Wednesday. Second, the market is now anticipating that the Fed is going to cut the Fed Funds rate before its next scheduled meeting, which will be held on September 18. The cut in the discount rate was nothing but symbolic. The discount rate, a lagging rate, follows money market rates. So, if anything, it was probably a shrewed move by the Fed. I guess market participants should go back an revisit their Money and Banking course to get a quick refresher on Monetary Tools. If the Fed really wants to be serious about providing liquidity to the banking system, the recommended policy would be to reduce the reserve requirement ratio that depository institutions (banks) must hold on their deposits (liabilities). This action would immediately provide instant liquidity by way of excess reserves. These are the reserves that banks can loan out. May be the Fed could surprise us a cut these requirements, which would immediately tell me that the subprime and condo problem is a whole lot worse than most investors think it is.
If we get the cut in the Fed Funds rate or reserve requirement ratio, investors must watch the performance of the financial sector, consumer sector, and utility sector for clues of the overall strength to the economy. However, these three sectors need to start out performing the S&P 500 and penetrate their well defined resistance lines. So far, they have not outperformed the market. The following charts depict the performance of the three sectors relative to the S&P 500:


Stay tone. Things are going to get really interesting, very shortly.
Tuesday, August 28, 2007
Housing Prices: Steepest Drop in 20 Years
Here is another sober thought to ponder that was stated in the recent issue of Barron's on August 27, "Up & Down Wall Street," There are over $1 trillion of securitized low-grade mortgages (subprime) outstanding and nearly three-quarters of a trillion dollars worth of mortgages whose adjustable rates are stated to rise over the next year."
The message from the above two reports assures us that the economy is about to experience an appreciably larger magnitude of pain in the months ahead. This is why I am now totally convinced that the Fed will not only cut the Fed Funds rate by 50 basis points but will provide sufficient liquidity (money) to save the entire banking system. When the Fed re-inflates, and they will, with a passion, the dilemma for them is the negative impact such a monetary policy has on the dollar.
Stay tone because all of this will come to the forefront in September. Oh, I forgot to mention that September will also bring earnings reports from banks and brokerages that will reveal the extent of their "losses" from subprime investments.
Monday, August 27, 2007
Markets at a Glance
What about this week? The subprime real estate bubble will continue to dominate the market. Last week's infusion of $2 billion into Countrywide Financial by Bank of America still leaves more unanswered questions, especially in the funding area for Countrywide. Now, we are hearing that condominiums have their own set of defaults and foreclosures. Major markets across the country, especially in parts of Florida, California, and Washington, D.C., are seeing rising foreclosures and bankruptcies of entire condo projects.
Another concern, near term, is that the market has been rising on low volume, which equates to lack of conviction. Also, the months of September and October have not been kind to the markets.
Monday, August 20, 2007
Presidential Cycle: Third-Year Correction
Time for an Update: Bear Market, Yet?
I also said on Friday, March 2, 2007, "Now, at what levels on the DJIA and S&P 500 will negate or call into question this current bull market? For the DJIA, the level is 11,783, or 4.5% from the current level. For the S&P 500, the level is 1,358 or 3.2% from the current level. At these levels, I would definitely become concern."
Given the market's frenzy over the past two weeks, are we to those levels on the DJIA and S&P 500 that I mentioned back in March 2007 where I would get very concerned? The answer is "NO." The low on August 16 for the DJIA was 12, 455.92. For the S&P 500, the low on August 16 was 1370.60. Since August 16, the DJIA and S&P 500 are up 5% and 6%, respectively, from their lows. Keep-in-mind that corrections during bull markets are usually 10% to 12%. So far, the recent corrections from the July 19 high to the August low on the DJIA and S&P 500 have been 11.79% and 11.87%, respectively.
Saturday, August 11, 2007
S&P 500: Long-Term Perspective
How is this investment strategy implemented? The following chart gives the specifics. It illustrates the 17-week and 43-week moving averages of the S&P 500 over the past decade. When the 17-week moving average is above the 43-week moving average, the market is in a "Bull" phase; and an investor should be fully invested. When the 17-week is below the 43-week, the market is in a "Bear" phase; and an investor should either be short or in cash (money market fund). There you have it. This investment strategy is very simple but, yet, very profound. Just check it out. Its performance has been excellent. By the way, an investor would have been out of the market debacle during 2001 and 2002 and in since 2003 following this strategy.
One other feature of the above chart is the index on the bottom. It is the "Relative Strength Index (RSI)" of the S&P 500. Its significance is that the index remains consistently above 50 during the "Bull" phase and consistently below 50 during the "Bear" phase.
Thursday, August 02, 2007
Seasonal Performance: Halloween Indicator Update
Thursday, May 03, 2007
Halloween Indicator Performance Record Since 1950

Any questions about the power of seasonality within the stock market? I didn't think so. Another way of looking at the above performance is as follows: "One dollar invested in 1950 using only November through April investment periods each year has grown to just shy of $43 today. Alternatively, one dollar invested only in the May through October periods since 1950 is today worth less than $2."
Thursday, April 26, 2007
MBA 642: May 1 Assignments and Readings on Interest Rate Parity and Arbitrage
For example, say $856.90 is converted to Canadian dollars at an exchange rate of 1.1670 CDW to $1 to buy a CDW1,000 6-month bond that pays an annual rate of 4%. At the end of 6 months, the investor would receive CDW1,020. If the exchange rate remains the same, the Canadian dollars can be converted into $874.03 (1,020/1.1670), which translates into a 4% annual rate of return. But suppose the Canadian dollar is expected to appreciate against the U.S. dollar, and so the forward rate is 1.1614 CDW per U.S. dollar. Then, the CDW1,020 will buy $878.22 (1,o20/1.614). This gives an annual rate of return of 4.98%. Thus, the investor earns 4% on the Canadian investment and then gains 0.98% on the appreciation of the CDW that leaves the net return of 4.98%. Therefore, given the prior assumptions, a 4% Canadian rate implies that the U.S. riskless rate on a 6-month bond should be 4.98%. If the U.S. and Canadian rates were the same 4%, then U.S. money would flow to Canada, driving down Canadian rates and driving up U.S. rates, until equilibrium has been reached (interest rate parity).
For Tuesday, May 1, read pages 944-966 of Chapter 27 "Multinational Financial Management." Focus your attention on the section entitled, "Trading in Foreign Exchange -- Interest Rate Parity." Do the following problems for Chapter 27: 2, 3, 9, 10, and 11.
In addition, refer back to the post of April 23 entitled, "Interest Rate Parity" and answer the question on the Indian INR arbitrage. Also, complete the arbitrage question from the handout on the Dollar and SF.
Monday, April 23, 2007
MBA 642: Interest Rate Parity
A good site for a currency converter on over 164 currencies is at Oanda.
Wednesday, April 18, 2007
MBA 642: De-Leverage ???
For Tuesday, April 24, be prepared to comment on the outlook for the Yen and Dollar.
You may want to check out the following link for the dollar.
Monday, April 16, 2007
MBA 642 Financial Management
In addition, we will review for your assessment next week. You will be responsible for the following concepts: DuPont Formula and its Applications, P/E Valuations, Cost of Capital Applications, Evaluating Cost of Equity through CAPM, NPV with Replacement Chain Analysis, and Coefficient of Variation.
Note: Please remember those families who have lost love ones at Virgin1a Tech.
Friday, April 13, 2007
Risk Management Indicators
Along with the Halloween Indicator, this indicator has proven to be a real “winner.”
Thursday, April 05, 2007
MBA 642: Assignments
In addition, read pages 454 to 464 (Chapter 13) on "Techniques for Measuring Stand-Alone Risk." Then, do problems 7 and 8.
Saturday, March 31, 2007
FINC 431 Finance: Assignment
In addition, we will have some lab time so that each group can calculate its stock "beta."
Friday, March 30, 2007
Market Quote
DJIA Monthly Gains
Wednesday, March 28, 2007
MBA 642: Yen Carry Trade
MBA 642 Financial Management: April 3 Assignment
1. Calculate the "Forward Looking Market Risk Premium" for your stock.
2. Determine the price set-up for your stock using "Technical Analysis."
3. Chapter 12 Capital Budgeting (Problems 1, 2, 3, 5, 7, and 12)
Wednesday, March 21, 2007
MBA 642 Financial Management: Assignments
1. Chapter 8 Analysis of Financial Statements (Problems 3, 4, and 5)
2. Chapter 10 Determining the Cost of Capital (Problems 1, 2, 3, 5, 6, 9, and 10). In estimating the risk-adjusted rate of return, our authors use the rate on the 10-Year TSY Note as the risk-free rate of return. Why? What is the rationale for using the 90-Day TSY Bill rate as the risk-free rate? What is the appropriate "Market-risk Premium" to use? Explain. Review "Estimating Market Risk Premium" on pages 324-326, especially "Forward-looking Risk Premiums.
3. Market Bounce Data: $SPXA50 (Level 100?), 10-day MA of $CPCE (Range .72 to .75?), and 60-day MA of $CPC (Level of 1.05+)
4. Technical Analysis: Price Set-ups for TLT
5. Beta Analysis: Group Endeavor
6. Million Dollar Challenge Update
Thursday, March 15, 2007
FINC 431 Finance
1. Read pages 359-366 of your text on the "Capital Asset Pricing Model (CAPM) and Securities Market Line (SML).
2. Read Chapter 13 on "Risk and Capital Budgeting."
Have a great Spring Break!
Saturday, March 03, 2007
Market Bounce! From What Level?
1. The first is the number of S&P 500 stocks above their 50-day MA ($SPXA50). Levels of 100 or lower are usually associated with market lows. As of Friday, March 2, it stood at 170.
2. The 10-day MA of the CBOE Options Equity put/call derivative indicator ($CPCE) has been good at identifying bottoms at levels between .72 to .75. As of Friday, March 2, it stood at .73.
3. The 60-day MA of the CBOE Options Total Put/Call derivative indicator ($CPC) will "flash" a bottom above 1.05. As of Friday, March, it stood at .94.
Will these indictors "flash" a buy this time? Time will tell!
Friday, March 02, 2007
MBA 642 Financial Management: Assignments
1. Chapter 4 (Bonds) -- Problem 14
2. Chapter 7 (Financial Accounting) -- Determine the "Free Cash Flow" for AAPL. Bring to class the financial statements for AAPL.
3. Chapter 5 (Basic Stock Valuation) -- Problems 2, 3, 4, 5, 6, 9, and 11
4. Be prepared to discuss the investment events of the past week and its significance, if any. Would you be a buy/seller of TLT and/or IWO? Check the chart postings on the blog for assistance with this question.
5. Portfolio Challenge (CNBC)
6. Calculating the Odds of a Recession: Go to the following site that is entitled "Political Calucations" and make you forecast. Use the data from Bloomberg in making your forecast. This is a very interesting exercise.
DJIA Performance: Average Third Year of Presidential Cycle

Tuesday’s market plunge of over 400 Dow points has drawn a lot of attention from the media. However, on a relative basis the decline was 3.3%, which, in fact, was the first significant decline since this “bull” rally started approximately five years ago. Typically, corrections during bull markets are anywhere from 10% to 12%. This 3% decline is nowhere near other bull market corrections. Don’t let all the media hype about this correction lose site of the fact that we are still in a bull market.
Look at above chart and recognize that two of the best performing months are March and April during the third year of the Presidential Cycle. Also, go back and revisit the “Halloween Indicator.”
Now, at what levels on the DJIA and S&P 500 will negate or call into question this current bull market? For the DJIA, the level is 11,783, or 4.5% from the current level. For the S&P 500, the level is 1,358 or 3.2% from the current level. At these levels, I would definitely become concern.
Wednesday, February 21, 2007
Calculating Free Cash Flow (FCF)
The relevancy of free cash flow is that it represents “real cash,” earnings do not.
Calculation for free cash flow is as follows:
1. FCF = NOPAT – Net Investment in Operating Capital
a. NOPAT = EBIT(1-Tax Rate)
b. Net Investment in Operating Capital = [Cash + Accounts Receivable + Inventories – (Accounts Payable + Accruals)] (Net Operating Working Capital) + Operating Long-term Assets (Net Plant and Equipment)
2. FCF = (NOPAT + Depreciation) – Gross Investment in Operating Capital
a. NOPAT = EBIT(1-Tax Rate)
b. Gross Investment in Operating Capital = [(Net Operating Working Capital + Operating Long-term Assets) + (Depreciation)]
Uses of FCF
1. Pay interest to debt-holders
2. Repay debt-holders
3. Pay dividends to shareholders
4. Repurchase stock from shareholders
5. Purchase marketable securities or other non-operating assets
MBA 642 Financial Management: Million Dollar Challenge!
Once the facilitator is selected, he or shee will register his/her team on CNBC for the “Portfolio Challenge.” See instruction below. I will the computer lab open so that each group can start the million dollar process. Good luck!
1. Go to CNBC (http://www.cnbc.com)
2. Click-on “Investing Tool.”
3. Click-on “Portfolio Challenge” to register.
4. Complete the registration procedure.
5. Challenge starts March 5, 2007
Stock Market Rallies
As the following chart indicates, the current bullish rally is approximately 4.5 years in duration, which is long by previous market rallies. In addition, its current performance during this rally is approximately +75% over the past 4.5 years, which is lags behind previous market rallies. Also, the current rally is below its linear-regression trend line. Will we have a revision to the mean (point on the line) or will this market rally continue to underperform?
Monday, February 05, 2007
Fama and French Three-Factor (Predictor) Model
Fama and French started with the observation that two classes of stocks have tended to do better than the market as a whole: (1) small caps [SML] and (2) stocks with a high book-value-to-price ratio [HML]. When they tested their hypothesis, they found small companies and companies with high B/M ratios had higher rates of return than the average stock (just as they hypothesized). Somewhat surprising by their research, however, they found no relation between beta and return.
They added two additional factors (predictors) to CAPM to reflect a portfolio’s exposure to size and B/M. The three-factor model is as follows:
ri = rf + bi(MRP) + ci(SMB) + di(HML) + alpha
One thing that is interesting is that Fama and French still see high returns as a reward for taking on high risk. For example, if returns increase with B/M, then stocks with high B/M ratio must be more risky than low B/M. Why?
Buy, Hold, or Sell
OER or It's All About Data Analysis
Sunday, February 04, 2007
January Indicator of Future Stock Performance
Saturday, January 13, 2007
Declining CRB Index Signifies Economic Weakness
In their latest weekly update, Comstock Partners, Inc. provided an interesting analysis of their findings of the recent decline in the "CRB Index." Quote:
"The idea that falling crude oil prices will boost the economy and overcome the plunge in housing is yet another instance of hope replacing reality. Despite its great importance, oil is just another commodity that goes up and down with the business cycle. When the economy begins to weaken commodity prices go down; when the economy is strong commodity prices go up.
Since its May high the CRB commodity index has dropped 22%, only the 7th time this has happened since 1974. According to ISI, since 1974 every decline in the index of 20% or more has been associated with either a recession, a significant slowdown or a financial crisis. Each of these periods has also occurred following a period of tight money and an inverted yield curve. In this regard it is also noteworthy that oil has not been the only commodity declining in price. Recent months have featured significant declines in a wide assortment of commodities such as copper, gold, sugar, hogs, wheat and corn. It is therefore likely that the oil price decline is itself a result of economic softening rather than an impetus to growth.
ISI also points out a number of other factors historically associated with significant economic slowdowns including the lagged effect of 17 rate hikes; the decline of house prices; the plunge in mortgage equity withdrawals (MEW); the inverted yield curve; significant slowing in the leading indicators; tightening by foreign central banks; and nominal GDP growth under the fed funds rate.
Source: http://www.comstockfunds.com
Friday, December 01, 2006
The Economy
"On CNBC, the pundits are talking about how the most recent spate of data has put Goldilocks scenario in danger. I must admit to finding it amusing how much faith so many players had put into Goldilocks, a most unusual and unlikely scenario.
The latest data forces me to revise my 50% possibility of a recession in 2007/08 up to 60%. GDP for Q4 '06 is likely to be between 0.5% - 1.5% (or worse, if Holiday sales keep trending softer).
As far as the Fed, this data suggests that the jawboning about inflation will remain just that -- while we still expect the Fed to cut before 2007 comes to an end, the odds of a hike anytime soon have just dropped significantly.
Given the awful PMI and ISM data -- they both broke the key "50" demarcation -- one may be wondering how GDP data ended up getting revised upwards. The answer comes from the way GDP is constructed. But even more importantly, observe which the components that increased the revised GDP -- these are symptomatic of a slowing economy:
Inventory build, government spending and imports, was responsible for virtually all of the 0.6% upward revision in GDP. Consumption, 70% of the US economy, is slowing.Revised higher:
Government spending (0.05%)
Inventory Build (0.26%)
Imports (0.39%)
Revised lower:
Exports were revised 0.2% lower.Consumption was revised 0.14% lower
Why are Businesses inventories increasing? Some pundits have claimed this is a bullish sign, an "anticipation of increased demand." I doubt this. We have seen recent CEO surveys which point to major negative sentiment amongst the usually cheery Execs; Durable Goods tumbled 8%, and Housing and Autos are likely already in a recession. My guess is that Just-in-time-inventory is easier to ramp than it is to slow down.
And while Reuters reported that "Business spending on inventories rose, increasing sharply to a $58 billion rate from the $50.7 billion earlier estimated." Inventories builds have increased at a faster than usual pace -- implying that this was (whoops!) unintentional.
Given the drop in both Durables and Capex, I am somewhat incredulous over Business spending being revised upward to show a 7.2% gain (versus 6.4% advance)."
Source: http://bigpicture.typepad.comSaturday, November 25, 2006
Determination of Exchange Rates

What is going on with the extreme weakness in the dollar (at a 19-month low)? What is causing the $USD to be so weak? From Chapter 21, which is entitled International Financial Management, we can make an inference as to the recent $USD weakness. Read pages 603-611 that provide insight for each of the following exchange rate determinates of the $USD: Income and taste, Changes in relative interest rates, Changes in relative price levels, Changes in fiscal and monetary policies, Changes in Balance of Payments, and Other Factors such as Oil Prices and SOX or SarbOX Act.
For Tuesday, October 28, be ready to discuss the causes for the $USD weakness.
Saturday, November 11, 2006
Yield Curve Says "Probable" 2007 Recession
John Mauldin notes:
"The yield curve became more inverted this week, with the negative differential between the 3-month and the 10-year at -49 basis points and a -76 basis point differential between the 10-year and the Feds fund rate. According to a Fed paper, that level of an inversion suggests there is now an over 40% probability of recession next year. This same model only predicted a 50% chance of recession in 2000, and as the paper authors acknowledge, the model probably understates risk in recent decades."
The yield curve and interest-rate data looks like this, which is from Bloomberg.com:
Source:
John Mauldin
Investor Insight, November 10, 2006
http://www.frontlinethoughts.com/article.asp?id=mwo111006
Thursday, November 02, 2006
Free Cash Flow (FCF)
To calculate FCF, go to a firm's cash flow statement. There you will find the line item entitled "Total Cash Flow From Operating Activities." From this number, subtract the number from 'Capital Expenditure," which is found in the next section of the Cash Flow statement entitled "Investing Activites."
For your firm, calculate the FCF for the past three fiscal/calendar years and trend the data. What is the trend? Keep-in-mind that a negative FCF is not necessary bad. It could be the result of some large capital expenditures, which in itself could prove to be highly profitable.
Thursday, October 26, 2006
Halloween Indicator
Wednesday, October 25, 2006
Risk and Capital Budgeting
Saturday, October 21, 2006
History Lesson
Thursday, October 19, 2006
All Time High for the DJIA, or Is It?
May be we should be purchasing gold, like GLD or GDX, and not equity stocks. What do you think? Make your comments during the coming week.
Saturday, October 07, 2006
Goldilocks' Rally?
The reason that I present this chart is because the stock market is indeed anticipating that the Fed will soon be reducing its "Fed Funds" rate (January or March) with the market making a "new" this past week. In addition, the rate on the Ten Year TSY (4.75%) is below the Fed Funds rate (5.25%), which in the past has been an excellent harbinger of lower rates. Go to Bloomberg at http://www.bloomberg.com/markets/rates/index.html to see the current interest rate structures. Also, the decline in energy prices, especially oil and natural gas, along with the expectations that corporate earnings for the third quarter are going to be very robust have helped propel the market higher. But, the stock market has completely ignored the recent inflationary comments by several Federal Reserve members, which does not bode well for a cut in interest rates, along with signs that the economy is slowing, as discussed in last week's post.
On Tuesday, Fed Vice Chairperson Donald Kohn stated that he is more concerned about inflation than slowing economic growth because a recession is unlikely. On Thursday, Charles Plosser, Federal Reserve Chairperson of the Federal Reserve Bank of Philadelphia, stated that the Fed's very credibility was at stake when it came to keeping prices under control. He was clearly concerned that the core PCE inflation is above 2%, and he expressed the need to raise the Fed Funds rate, not lower it. Please remember that he, who has the gold, in this case the money, makes all the rules! And the Fed has all the money, therefore, it makes all the rules as it pertains to the financial markets and the economy. Therefore, don't count on the Fed reducing rates unless inflation, as measured by the PCE, comes down below 2%.
Monday, October 02, 2006
Risk-adjusted Rate of Return (Beta Analysis)
Friday, September 29, 2006
Wednesday, September 27, 2006
Be Forewarded!
If one combines the track record of the LEI with the current negative to flat Yield Curve, a 2007 slowdown of significance definitely looms on the economic horizon. The probability will increase if the September 2006 LEI comes in under 0.50%, and the Yield Curve remains flat to negative.
Cost of Capital
Our discussion yesterday pertained to historical cost of capital computations. If a company was to issue new preferred and/or common stock, one would have to incorporate a fee that the company has to pay to the investment banker for selling the "new" security. This fee is referred to as the "floatation cost." Since it is a cost, the firm's cost of capital for preferred and/or common will increase. For our equation for "cost of NEW common stock equity," the refinement to our basic equation is as follows: [(EXPECTED DIVIDEND/(PRICE-FLOATATION COST)] + GROWTH RATE OF DIVIDEND. If you were calculating the "Cost of New Preferred," you would make the same adjustment by inserting the floatation cost into the equation.
Friday, September 22, 2006
WTIC (Oil Light Crude) Revisited
First, look at the top portion of the chart that is entitled "Full Sto," which is a Stochastic Oscillator. I want to draw you attention to the "arrows" on the oscillator. Notice that the level of the oscillator at each arrow reads "20 or lower." Subsequently, the price of oil rose and in some cases, significantly. Second, look at the bottom portion of the chart that is entitled "CCI," which is the Commodity Channel Index. As before, isolate on the "arrows" and notice that the levels were "-100 to -200" and the subsequent price rise. The Stochastic Oscillator and Commodity Channel Index measure short-term levels of being "overbought or oversold." Therefore, given the current, extremely, oversold readings, oil prices should move higher in the near term. Probably, oil could rise back to its 50-week EMA and the downward sloping resistance line, which is $66 or about 7%. If the $66 level is not significantly penetrated, oil should continue its price decline to the $51 level. Once again, this analysis is based on current world conditions. If the "geo-political" environment deteriorates, all "bets" are off. In the meantime, enjoy these gasoline prices. By the way, I paid $1.99 today to fill by Yamaha Waverunner.
For Tuesday, apply the Stochastic Oscillator and Commodity Channel Index to your stock and indicate if the stock is "overbought or oversold."
Thursday, September 21, 2006
Technical Analysis
Wednesday, September 20, 2006
Amaranth
Monday, September 18, 2006
Williams%R
Using the EFA chart previously posted, how would you incorporate the "Williams%R and MACD" into generating buy and sell sigals? Be prepared to discuss the "Williams%R and MACD" concepts on Tuesday.
MACD Formula
Of the two moving averages that make up MACD, the 12-day EMA is the faster and the 26-day EMA is the slower. Closing prices are used to form the moving averages. Usually, a 9-day EMA of MACD is plotted along side to act as a trigger line. A bullish crossover occurs when MACD moves above its 9-day EMA, and a bearish crossover occurs when MACD moves below its 9-day EMA. The EFA chart below shows the 12-day EMA (thin blue line) with the 26-day EMA (thin red line) overlaid the price plot. The EFA chart below shows the MACD in the box below as the thick black line and its 9-day EMA is the thin blue line. The histogram represents the difference between MACD and its 9-day EMA. The histogram is positive when MACD is above its 9-day EMA and negative when MACD is below its 9-day EMA.
Based on the MACD formula, would you be a purchaser of EFA? Explain.
The URL for a full discussion on the MACD formula can be found at http://stockcharts.com/education/IndicatorAnalysis/indic_MACD1.html.
Monday, September 11, 2006
Charts
Commodity Research Bureau Index, Crude Oil, and Gold Plummet
With today's price action, these markets are in the most "oversold" since last year. Therefore, expect a strong rally back up to the 50-week EMA as shorts cover to lock-in profits. Overall, I am still expecting oil to sell in the low $50's before this decline is over.
Make sure you visit the course Web page, because I have some exercises for you to do for tomorrow's class.
Saturday, September 09, 2006
How Low is Low?
CRB Index has penetrated its 50-week EMA average, which does signal an end to its five-year major trend. However, since the 50-week EMA is above the 200-week EMA, the commodity bull market is still intact. What we can expect is a "correction" down to the 200-week EMA, which is currently about 300. Ok, what does this chart have to do with the price of oil? Everything. Take a look at the following $WTIC chart, which is the "Light Crude Oil."
The price ($67.15) has penetrated its 50-week EMA ($67.39). $WTIC is following the price action of $CRB. Like the $CRB, $WTIC is still in a major bull market. Therefore, a reasonable downside price objective for oil is at the 200-week EMA, which is $51. By the way, that should equate to about $1.70 at the pump and still leave the major oil bull market intact.
You may have noticed that the two charts include some additional information (PPO and Full Sto) besides the "price." We will discuss these market indicators next week. In the meantime, enjoy these gas prices!
Thursday, September 07, 2006
Quote of the Week
Sunday, September 03, 2006
Turn-out the Lights
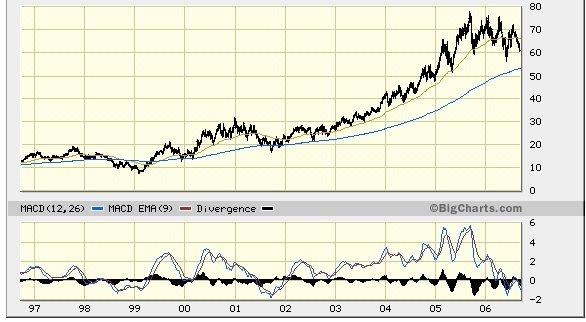
The following chart that relates the National Association Homebuilders Index to the S&P 500 Index is from David Rosenberg, North American economist for Merrill Lynch.

Lon Witter, writing in the August 13 edition of Barron's, argues that there has not been a housing bubble but a lending bubble. He provides the following data to back-up his thesis:
1. 32.6% of new mortgages and home equity loans in 2005 were interest only, up from 0.6% in 2000.
2. 43% of first-time home buyers in 2005 put no money down.
3. 15.2% of 2005 buyers owe at least 10% more than their home is worth.
10% of all home owners with mortgages have no equity in their homes.
$2.7 trillion dollars in loans will adjust ot higher rats in 2006 and 2007.
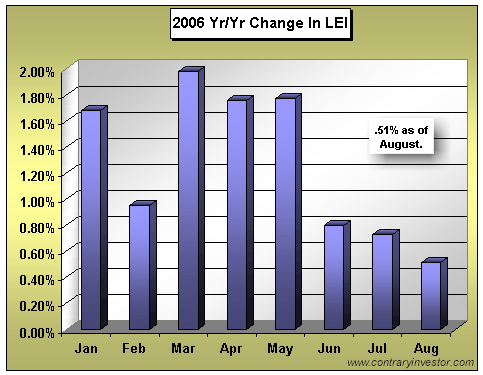
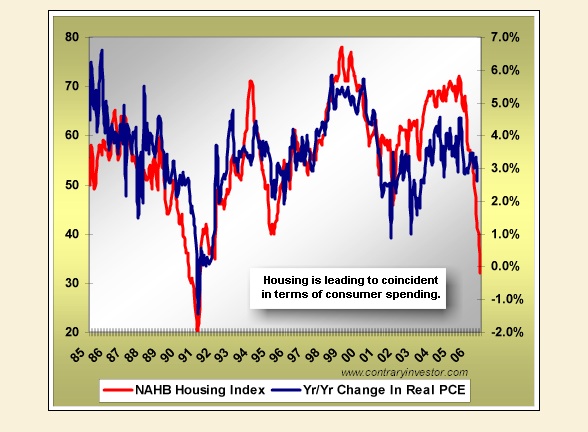
Once again, let the reader beware. Think the above information may foreshadow trouble for financial stocks and the overall equity market? However, it gets more interesting, see the following chart, which is from ContraryInvestor.Com, that relates the NAHB Index to Real Personal Expenditure Consumption (PCE):
The above chart links housing to consumer spending. As you can see, at least in the past, there has been a very high degree of correlation between the NAHB Index and the direction of real PCE. Why is this relationship relevant? In regard to GDP, PCE comprises more than 70% of overall economic activity. If indeed this relationship continues, we may see real PCE in the negative column, which, of course, would result in very weak GDP numbers going forward from here.
We definitely monitor the NAHB Index and real PCE throughout the semester.