Federal Accounting Standards Board (FASB) Statement 157 requires all publicly-traded companies in the U.S. to classify their assets based on the certainty with which fair values can be calculated. This statement created three asset categories: Level 1, Level 2, and Level 3. Level 1 assets are the easiest to value accurately based on standard market-based prices and Level 3 are the most difficult. FASB 157 was passed to help investors and regulators understand how accurate a given company's asset estimates truly were.
Level 1 Assets have readily observable prices and therefore a reliable fair market value. These assets include listed stocks and bonds or any assets that have a regular “mark to market” mechanism for pricing. Publicly traded companies must classify all of their assets based on the ease that they can be valued, with Level 1 assets being the easiest.
Level 2 Assets that do not have regular market pricing, but whose fair value can be readily determined based on other values or market prices. Sometimes called “mark to model” assets, these asset values can be closely approximated using simple models and extrapolation methods using known, observable prices as parameters. Part of an overall requirement of publicly traded companies is that they are required to report to investors the makeup of their assets based on certainty of fair value calculations.
Level 3 Assets whose fair value cannot be determined by using observable measures, such as market prices or models. These assets are typically very illiquid, and fair values can only be calculated using estimates or risk-adjusted value ranges. I like this method of determining fair value assets as "mark to myth," or "mark to management's best guest," or "mark to a hope and a prayer."
Prior to the implosion of the past several weeks, Merrill Lynch stated that it's most difficult to value Level 3 assets (First Quarter of 2008). Its percentage of Level 3 assets to total shareholders' equity was 130%. Bear Stearns' percentage of Level 3 assets to total shareholders' equity was 314%. Goldman Sachs' percentage of Level 3 assets to shareholders' equity was 192%. Lehman Brothers' percentage of Level 3 assets to shareholders' equity was 171%. Morgan Stanley' percentage of Level 3 assets to shareholders' equity was 235%.
The dynamics of the past couple of months demonstrate that the financial community has forgotten what they should have learned in any basic finance course is that leverage is a "two-edged sword." It enhances profits during the expansion phase of the economy but exacerbates the overall profitability during economic downturns.
All companies must immediately disclose the dollar amount of Level 1, 2, and 3 assets to the public. I am not talking about this disclosure in the 8-Ks, 10-Q's or 10-Ks. What I am recommending is that financial service sites, such as Morningstar, Yahoo Finance, Wall Street Journal Online, Barron's Online, etc., incorporate this data when they provide balance sheet information to the public.
Saturday, September 20, 2008
SEC and Financial Leverage
Want to get really mad? Up until 2003, all investment banks were allowed only 12 to 1 leverage (Equity Multiplier). If you recall from our session last week, that a leverage factor of 12 means that asset values would have to decline in value by only 8.3% to completely wipe out a firm's capital (net worth). Then in 2004, the SEC basically gave just five investment banks the ability to leverage up to 30 or even 40 to 1. At 40 to 1, asset values would only have to decline by 2.5% to completely wipe out a firms capital. Anyone want to place a bet on naming those five investment banks? They were Bear Stearns, Lehman Brothers, Merrill Lynch, Morgan Stanley and Goldman Sacs. (Three down and two to go)
Barry Ritholtz wrote in the Big Picture: "So while the SEC runs around reinstating short selling rules, and clueless pension fund managers mindlessly point to the wrong issue, we learn that it was the SEC who was in large part responsible for the reckless financial leverage that led to the current crisis." (Don't get me started on blaming the short sellers. Let's put the blame on where it directly belongs. That is the SEC for allowing investment banks to increase their leverage and the individuals who leveraged their companies 40 to 1 with bad investments to enhance profits.)
What the SEC has to do immediately is to have all investment banks reduce their leverage factor to the pre-2004 level of 12:1 from the current 30-40:1.
Thursday, September 11, 2008
Don't Bail Them Out!
Conventional wisdom states that our government did not have a choice. It had to "bail" out FannieMae and FreddieMac, because according to this wisdom it was a natural disaster. It had to come to the rescue by pouring billions, if not trillions, of dollars at the problem. If our government did not intervene, this wisdom states our economy would suffer the consequences of another "Great Depression."
Non-traditional wisdom states that the price system through market operations should prevail, not government intervention that usurps the market's ability to determine asset values. "This wisdom states that what should have happened in 1929 is precisely what should happen now. The government should completely remove itself from the course of action and let the market reevaluate resource values. That means bankruptcies, yes. That means bank closures, yes. But these are part of the capitalistic system. They are part of the free-market economy. What is regrettable is not the readjustment process, but that the process was ever made necessary by the preceding interventions, which will make the underlying problem worse!"
Wednesday, September 10, 2008
The Spending Explosion: Will it ever stop?
Interesting article today in the "Wall Street Journal." From its "Review and Outlook" section, they analyze the spending debacle coming out of Washington, D.C. as promulgated by the Congressional Budget Office.
Oil Prices: WTIC (West Texas Intermediate Crude)
From the post of Monday, September 8, I illustrated the close relationship (inverse) between the dollar and oil over the past year. That is, when the dollar strengthens, oil prices weakens. The following "Point and Figure Chart" on oil, which is the type of chart I use to discern long-term price trends, reinforces that relationship. Major support has been broken significantly. The downside price objective is now currently at $96. Who would have thought back in July when oil was at $145 that we would be discussing oil under $100. And, who would have thought a few short month ago that the dollar would be one of the strongest currencies in the world. I have learned many lessons in trading stocks over my investment career, but the best "lesson learned" is to always let the market tell you what to do, rather than trying to tell the market what to do.


Tuesday, September 09, 2008
Fannie and Freddie: Understanding the Financial Crisis
FDIC insured banks have about 8% of capital (net worth) for their outstanding assets (equity/asset ratio), which are mostly loans. Fannie and Freddie had an equity/asset ratio of 2%. What this means is that for $50 of assets, they had debt of $49 and $1 of equity. In other words, Fannie and Freddie used a lot of debt (leverage) to purchase their assets (mortgages).
What this means is that for every $1 million in capital (net worth), Fannie and Freddie can lend out $50 million. The profit is the difference in the cost in acquiring the debt and the interest rate that Fannie and Freddie received. Let's assume that Fannie and Freddie earned 8% on its assets and had to pay 4% for its debt. The difference of 4% is its gross profit, or 4% times $50 million is $2 million. Now keep-in-mind, Fannie and Freddie had $1 million in equity but earned $2 million. Nice profit!
Of course, you have to be able to take some losses, which, of course, Fannie and Freddie were not prepared to do given the sub-prime debacle of the past year. If they had a $3 million loan go bad, they would have completed depleted their profits and wiped-out all their capital. If Fannie and Freddie were going to exist, they would have had to raise additional capital, which no one wanted to do, or sell off their assets (mortgages), which, of course, no one wanted. And that is the reason why the government intervened. The government is not calling it a "bail-out," but else would you call it.
Monday, September 08, 2008
Dollar, Gold and Oil "Price" Relationships
The relationship between the dollar (UUP) and both gold (GLD) and oil (USO) over the past two two years has been inversely related. See the following chart:
 From the chart, one can observe that the peak in oil and gold corresponded to the low in the dollar in July 2008. Since then, the dollar has rallied and both oil and gold have decline. The key going forward from this point must be to track what happens to the dollar. We will definitely follow this relationship.
 From the chart, one can observe that the peak in oil and gold corresponded to the low in the dollar in July 2008. Since then, the dollar has rallied and both oil and gold have decline. The key going forward from this point must be to track what happens to the dollar. We will definitely follow this relationship.
GDP: Growth Adjusted Upward by 3.3% for Second Quarter
The initial version for second-quarter GDP growth was an increase of 1.9%. This growth was revised upward to a very robust 3.3%. Should one start singing "Happy Days are Here Again?" I for one will not start singing the chorus. The key to the revised figure is the "GDP deflator," which is a macro inflationary statistic. (Side Bar: The lower the deflator, the greater the growth of GDP will be.) Now, according to this deflator (inflationary measure), inflation grew at only 1.33% during the second quarter. Does anyone believe that? John Williams of the Shadow Government Statistics points out that the supposed 1.33% increase would represent the lowest inflation rate in five years. Interesting that the CPI number for the same quarter was up 8%! I guess the two computers that measure the GDP deflator and CPI numbers don't communicate with each other. By John's calculations, the GDP would have contracted by 2.9% year-over-year.
Monday, September 01, 2008

Future Price of Oil
From the following chart of West Texas Intermediate Crude Oil, what is your estimate for its price? Explain how you arrived at your forecast.

Price of Gas: Facts and Economic Logic
Read the following article entitled, Economics 101: The Price of Gas. Prove by using the price calculator from the Federal Reserve Bank of Minneapolis that based on just "inflation and taxes" that the price of gas today should approximate $3.28.
Based on the profit margin of major oil and gas companies in relation to other industries, why do you think that the oil companies are being singled out by the media?
Sunday, May 11, 2008
How does one identify the underlying trend of the market for optimizing profits?
As of May 9, 2008, the market as measured by the S&P 500 (SPX) is currently in a major correction or bear market. In determining the market trend, the relationship between the 15-week and 40-week EMAs (Exponential Moving Averages) is a very useful investment tool. If the 15-week EMA is above the 40-week EMA, the market trend is up. Conversely, if the 15-week EMA is below the 40-week EMA, the market trend is down. Take a look at the following ten-year chart that illustrates the significance of the relationship between the 15- and 40-week EMAs:

Clearly, the 15-week EMA lies below the 40-week EMA. Therefore, from a market trend perspective, the market is in a major correction. Over the past ten years, this investment approach has been excellent. If the investor would have sold his/her S&P 500 investment in late 2000 at approximately 1,450 and then purchase it back in early 2003 at approximately 925, that investor would have eliminated a 36% lost. Purchasing at 925, early 2003, and holding the investment until January 2008, you investment return would have been 57%.
Currently, investors would be out of the market and in a money market fund or an inverse ETF, such as DOG, DXD, SDS, or QID.
Saturday, May 03, 2008
It's Not Over Until It's Over
As promised from Thursday’s post, the identification of the graphs is as follows (Contrary Investor and StockCharts:

Over the twelve plus year period the 50- and 200-day EMA lines have crossed four times. Once in 1998, the 50-day EMA briefly pierced the 200-day EMA to the downside, suggesting a move into bear territory. The next cross to the downside was seen in late 2000 (dot.com debacle), warning of an equity market plunging into its largest and most extended bearish episode in many years. It was not until May of 2003 that the 50-day EMA crossed back up through the 200-day EMA. And, in January 2008, we have seen a cross to the downside. Until the 50-day EMA moves back up above the 200-day EMA, my position is to assume a defense investment position, such as being invested in a money market fund and/or inverse ETFs like DOG, SDS, DXD, and QID. Also, had one followed this very simple indicator over time, one’s financial health could have been greatly enhanced.

Over the twelve plus year period the 50- and 200-day EMA lines have crossed four times. Once in 1998, the 50-day EMA briefly pierced the 200-day EMA to the downside, suggesting a move into bear territory. The next cross to the downside was seen in late 2000 (dot.com debacle), warning of an equity market plunging into its largest and most extended bearish episode in many years. It was not until May of 2003 that the 50-day EMA crossed back up through the 200-day EMA. And, in January 2008, we have seen a cross to the downside. Until the 50-day EMA moves back up above the 200-day EMA, my position is to assume a defense investment position, such as being invested in a money market fund and/or inverse ETFs like DOG, SDS, DXD, and QID. Also, had one followed this very simple indicator over time, one’s financial health could have been greatly enhanced.
Thursday, May 01, 2008
Double Your Pleasure or Double Your Pain

Since January 2008, my position has been that the market is either in a major correction or the start of a "Bear Market." Therefore, I thought it was about time to revisit that position.
When it comes to the stock market, I am a trend follower, or momentum trader. I adhere to moving averages as a technical tool to determine and identify the trend of the market, i.e., Bull Market and Bear Market. Overtime, the 50-day EMA and 200-day EMA has been very useful in identifying the underlying trend of the market. That is, when the 50-day EMA is above the 200-day EMA, the market trend is up. Conversely, when the 50-day EMA is below the 200-day EMA, the trend is down. (You may want to read some of my previous posts on the subject of moving averages. You may find them very educational and profitable to your financial well-being.)
Referring to the above two charts, I have left off the time in terms of when the two charts were created. Both charts are depicting that the 50-day EMA has turned up, even though it still lies beneath its 200-day EMA. Is this a foreshadowing event of the start of a new "Bull Market?" The market, as depicted by the S&P 500, has rallied over the past month, as indicated by one of the two above charts.
Tomorrow, I will reveal the dates and the results of the above charts.
Monday, March 17, 2008
Assurance from President Bush
Bush gives assurance that the U.S. is "on top" of the financial situation. Wow! Isn't that reassuring as the dollar plummets against the EURO and the price of gold exceeds $1,000. Thank you, President Bush. This is the same type of rhetoric that we heard a year ago about the "sub-prime mortgage" problem. Let's put the blame where it directly belongs. That is squarely on the shoulders of the Federal Reserve System.
The Impudent Boldness of Greenspan
Former Federal Reserve Chairman, Alan Greenspan, warns that we face the worst financial crisis since 1945. This is the same man whose tenure at the Fed gave us the dot.com debacle and the sub-prime debacle through his expansionary monetary policy of excess liquidity. So much for accountability, Mr. Greenspan.
Monday, March 10, 2008
Market Update
The market as measured by the 15-week EMA in relation to the 40-week EMA continues to correct. As long as the 15-week EMA lies beneath the 40-week EMA, this market correction or bear market will continue. Therefore, investors must continue to take a defensive posture during this time. Either stay very liquid (Money Market Fund), short selective securities, or purchase inverse ETFs, such as DOG, SDS, SIJ, and/or DXD.


Monday, February 18, 2008
Double Jeopardy
What you are looking at in the chart below is the 50 and 200 day moving averages of the very same S&P over two different cycles or time horizons. Focus especially on the relationship of the 50-day MA to the 200-day MA along with the directional movement of the 200-day MA. Does this chart along with the moving averages provide you with any clues about the direction of the market? Tomorrow, we will identify the time horizons.
 Source: Contrary Investor

Tuesday, February 12, 2008
Çredit Crisis: Precursor of Great Inflation
An excellent article on the causes of economic "booms and busts" is not only thought provoking but just might make you mad. After you read the article, ponder the following questions: What is the Fed's explanation for economic booms and busts? Who is the Fed accountable to? Why does the Fed appear to get a "free pass" from the media and politicians?
Thursday, February 07, 2008
Bear Market Rallies
Alan Abelson, who writes a column for Barron’s, states in last week’s edition that during the 2000-02 bear market, there were no fewer than 16 rallies of at least 5% in the S&P 500, each lasting on average about a month, and no fewer than 35 bounces of 5% or more in the NASDAQ, which still managed to wind up losing nearly 80% of its value. In other words, this bear market is not over yet. Therefore, your investment mentality should be the mirror image of what it was during the bull ride from 2003-08. That is, sell the rallies.
Monday, February 04, 2008
Dollar as the International Reserve Asset
What are the implications for the value of the dollar, given the following chart?


Tuesday, January 29, 2008
The Great Fiscal Stimulus Package of 1929
Does the title sound familiar, with the exception of 1929? Read the article and see if you can substitute 2008 into the title. Article is located at Mises.org. Make sure that you follow the link to the original article that was published in Times Magazine.
Tuesday, January 22, 2008

Saturday, January 19, 2008
The Market Has Spoken!
The weekly 1387 level on the S&P 500 was taken out this week (See chart below). Given this penetration, we are now either in a "major correction or bear market." Therefore, our focus will be on sell signals rather than buy signals. Sell signals are the mirror image of buy signals. Our primary bear market instrument is the SDS, which is an inverse ETS of the S&P 500. As an inverse ETS, its price rises when the market (S&P 500) sells off.
Since the market is extremely oversold, we should expect the market to rally short-term. Keep-in-mind that this is not a time to me looking for a major bottom. Don't get sucked in by those pundits who will be screaming that this is a golden opportunity to buy. Prepare yourself mentally to either short the market or purchase inverse ETFs, like SDS. The best chance for the market to make some kind of a bottom, based on market cycles, is around March 27, 2008.
 Source: Jack Chan's "Simply Profits"
Since the market is extremely oversold, we should expect the market to rally short-term. Keep-in-mind that this is not a time to me looking for a major bottom. Don't get sucked in by those pundits who will be screaming that this is a golden opportunity to buy. Prepare yourself mentally to either short the market or purchase inverse ETFs, like SDS. The best chance for the market to make some kind of a bottom, based on market cycles, is around March 27, 2008.

Wednesday, January 16, 2008
Inflation Jumps in 2007
Inflation rose to 4.1% in 2007 from 2.5% in 2006, which is the largest increase in 17 years! Take a look at the following chart of the growth of money. That just might help explain a good part of the reason for the increase in inflation.


Tuesday, January 15, 2008
Market: Critical Junction
As indicated in my post of January 15, 2008, all four long-term indicators have now turned "bearish." From a short-term perspective, this market is very "over sold," which should generate a price reaction back to resistance near term. If this is a start of a new bear market, similar to 2001-2002, the SPX must take out 1387 on a weekly basis. See the following chart from Jack Chan at Simply Profits. I will monitor very closely this critical level.


Investment Trend
As we head into 2008, the market is giving very negative (bearish) signals. If you have followed this blog over the course of the past semester, you would have been keep abreast of the key turning points to the market trend, especially the SPX's weekly 17-and 43-EMA's, which has been refined to a weekly 15 and 40 EMA's. Over this semester, I will continue monitor this long-term indicator along with three others, which are from the "Contrary Investor." These three indicators are the SPX Trend Line from 2000, SPX's 80-week MA, and SPX's 10- and 40-week MA. All four indicators are currently negative.


Wednesday, October 31, 2007
S&P 500 Index: Home Building vs. Department Stores
The following chart does not bode well for overall consumer confidence and the economy, especially for retail sales as we enter the Christmas shopping season. Keep-in-mind that consumers constitute approximately 71% of GDP.
 Source: The Big Picture

Tuesday, October 30, 2007
Today's FOMC Meeting
On September 17, the Fed cut the Fed Funds rate by 50 basis points to 4.75%. This was the first rate cut by the Fed in 18 months. The rationale given by the Fed was because of the precarious situation of the credit markets, which really means the subprime mortgage mess.
Today, the Fed will cut the Fed Funds rate by 25 basis points. At least this is the betting line over at the Chicago Board of Trade. 98% of the traders are pricing in a 25 basis point cut, while only 8% are pricing in a 50 basis point cut. I am firmly in the camp of another rate cut, because our credit problems (subprime mortgages and SIV's) are still with us.
The importance today is not the Fed's action but the reaction of the markets, currency and equity. Rates cuts are generally considered bullish for the equity market, except when a recession is looming on the economic horizon. Thanks to the Contrary Investor for providing the following insight on the rates cuts that preceded the previous recession.

On January 3, 2001, the Fed cut the Fed Funds rate by 50 basis points; and the S&P 500 responded with a gain of 5%. Interesting the rate cut a month ago resulted in a 2.9% increase in the S&P 500.
Learning point is that not all rate cuts are bullish, but rather the key is the reaction of the financial markets to any change in monetary policy.
Learning point is that not all rate cuts are bullish, but rather the key is the reaction of the financial markets to any change in monetary policy.
Friday, October 05, 2007
Washington Mutual's Earnings To Suffer From Mortgage Woes
The "Wall Street Journal" has just reported that Washington Mutual, one of the nation's largest mortgage originators, expects to set aside nearly $1 billion on a pretax basis in the third quarter to cover potential future mortgage losses and record a $150 million writedown on mortgage loans it planned to sell. Chairman and Chief Executive Kerry Killinger said, "While we're disappointed with our anticipated third-quarter results, we look forward to an improved fourth quarter as we continue to see good operating performance in our retail banking, card services and commercial group businesses." Did you noticed that he did not mention any improved performance for the mortgage side of the business for the fourth quarter.
Thursday, October 04, 2007
Technical Analysis: Would You Purchase this Stock?
Question: Refer to the following "Point & Figure Chart" that goes back to 2003 and decide if you would purchase this stock. Point & Figure Charts provide a long-term perspective of price action. The X's indicate the price is rising and O's indicate the price is declining.

Answer: In your response, indicate the reason for your decision. [There is neither a right or wrong answer.]

Answer: In your response, indicate the reason for your decision. [There is neither a right or wrong answer.]
Monday, October 01, 2007
Dollar Strategy
Yesterday was a great day on Wall Street. DJIA up 192 points or 1.38%, which puts the market back above 14,000. This surge in the market came despite Citigroup announcing that its profits may decline by 60% for the current quarter because of its subprime credit problems. Therefore, why did the market go up? Because the dollar is weak! That is the current conventional wisdom on Wall Street. A gradual dollar decline will help exports, which will be good for the economy. However, the optimal word is "gradual." If the dollar falls too fast, it could cause interest rates and inflation to rise, stock market to plummet, and foreigners to sell Treasury debt securities. Not a good scenario. However, take heart in that most economists believe that the dollar decline will be gradual and will not cause any major dislocations to the economy. In fact, the majority of economists, inclusive of the Fed, are saying that a weak dollar will help cushion the subprime real estate correction and be a real plus for the U.S. economy. In other words, the dollar decline will be contained. I believe we have heard all this before in which the containment crowd said that the subprime problems is not a cause for concern. I don't know about you, but I am not buying it. Then again, you be the judge and look at the following link that illustrates the dollar's performance: Trade-weighted value of the dollar.
Wednesday, September 26, 2007
What is the Dollar Worth?
The answer to the question in the title is "not much!" But then again, it depends on one's time horizon. However, if we go back to 1913, which by the way was the year that the Federal Reserve System was established, a dollar in 1913 would be worth only a "five cents" today. This is very interesting, because one of the Fed's main objectives is to maintain a stable currency as the protector of our economy's stability. Then again, in this day and age, who wants to be accountable for one's action.
Since the Fed cut the Fed Funds rate, it seems every currency, inclusive of Third World currencies, in the world has rallied against the dollar. The Euro is at an all time high, recently the dollar was trading at $1.412 to the Euro. Even the Canadian dollar (loonie) is now at par against the dollar, which is the first time in three decades. However, take solace, the dollar did hold its own against the Zimbabwean dollar where inflation in that country is only running at 15,000% a year.
In addition to the dollar's weakness against currencies in general, the price of oil exceeded $84 a barrel; and with the prospects of reflation, the price of gold went to $740.
Don't worry. The Fed has everything under control. Just look at how well they have protected the value of the dollar.
Tuesday, September 18, 2007
August Wholesale Prices Fall Sharply (What about core inflation?)
"The 1.4 percent decrease, the biggest since October 2006, followed a 0.6 percent increase in July, the Labor Department said today in Washington. So-called core prices, which exclude fuel and food costs, rose 0.2 percent after a 0.1 percent gain the month before."
The reason that I posted this information is to inform you that the market will do anything to justify a rate cut by the Fed. The whole emphasis in today's financial press is on the decline of wholesale prices, which in effect is saying that inflation at the wholesale level is in check. Therefore, the Fed can go ahead and cut interest rates. However, what is completely ignored is the fact that just a month ago the emphasis by the financial media was on "core inflation." And, if you noticed the last sentence in the first paragraph, you read that core inflation rose .2%, which on an annual basis is 2.4%. This was double from the previous month. The Fed generally would like the core inflation to be between 1% and 2%.
Will the Fed cut the Fed Funds rate? You bet! Will the equity markets be satisfied? Probably not. That is why the old Wall Street adage will probably be true, which is "Buy the rumor and sell the news."
Thursday, September 13, 2007
Root Causes of Financial Bubbles
All financial bubbles, subprime included, start when the banking system is awash with liquidity (money). Then, the question one must ask is who or what provides the liquidity to the economy in the first place? From your course in Macroeconomics, you learned the answer to that question as being the Federal Reserve System. Therefore, the Fed initiates any financial bubble through increasing reserves (money) to the banking system, which in effect will lower interest rates. Then, banks, which now find themselves with additional reserves, will do what they are in business to do; and, of course, that is to make loans, i.e., mortgages. Because of low interest rates, which is caused by the increase supply of reserves, individuals are more than happy to borrow money, in this case, for that new home or refinance their current home and draw down any home equity that is available.
Another question to ask is why and when did the Federal Reserve increase reserves to the banks? The Fed started its current monetary expansion program after the last recession, 2002. The Fed realized that since the consumer is such an important component of GDP, something like 71%, it needed a catalyst to stimulate the economy. The consumer was that catalyst. By providing and injecting reserves to the banking system, the Fed knew that the desired outcome of GDP growth would occur through the assistance of the banking system and individual borrowers. However, this contrived real estate bubble has finally burst, as all bubbles do, and the consequences are going to be felt for many years to come. The Fed's solution will be to simply reinflate the economy and create another bubble.
What I find interesting about this current subprime mess is that no one or a very small fraction of the financial world is looking at the Fed as the real culprit or villain. However, I do hear that the subprime mess is the fault of mortgage banks, credit agencies, and hedge funds. But I firmly believe that these entities are not the "root" cause of the problem. For that, simply look at the Federal Reserve and its expansionary monetary policies.
By the way, the chart from my post of September 3, which was entitled, “Picture is Worth a Thousand Words,” is that of the Money Supply. The chart can be accessed at the following URL: http://research.stlouisfed.org/fred2/series/MZMNS.
Saturday, September 08, 2007
The Next Subprime Mess
Get ready for another financial debacle. This time it is going to be those nasty SIVs. No, I don't mean SUVs, which I guess the "Green Movement" would consider to be nasty. SIVs stand for "Structured Investment Vehicles. Trust me, SIVs will become as well known as those SUVs we drive.
These investment vehicles are entities that banks use to issue commercial paper, which is a money market instrument. With the proceeds, banks purchase corporate receivables, auto loans, credit card debt, and, yes, mortgages. Why is this so alarming? Take Citigroup, for example. Citigroup owns about 25% of the market for SIVs, which is approximately $100 billion according to the "Wall Street Journal" in its September 5, 2007 edition. Yet, in its 2006 filing with the SEC, there is no mention of it. What? How can this be? Well, accounting rules don't require banks to separately record these type of off-balance sheet investment vehicle on their main financial statements. One would have thought that the accounting profession would have learned something from Enron, World Com, and Global Crossing. The demise of each of these companies was directly tied to off-balance sheet vehicles.
The Federal Reserve System has a major challenge ahead of itself in trying to bring stability and trust back to the financial markets. In my opinion, these challenges are a direct result of their own polices instituted during the past five years. The banks and financial markets did not create this subprime mess or pending SIV mess. The Fed did that all by themselves. The banks and financial markets were just reacting to what the Fed was doing. That is, when the Fed reinflated the banking system with reserves (money), banks made loans. Because interest rates were low, which was caused by the Fed reinflating the banking system, individuals were more than happy to refinance their homes and draw down their home equity. This resulted in real GDP growth. However, the consequence of all this liquidity has been the inflation of all financial assets. Like all bubbles, they do burst; and we have already seen the subprime bubble burst. The next one just could be those nasty SIVs.
Monday, September 03, 2007
Picture is Worth a Thousand Words
A picture is worth a thousand words is a proverb that refers to the idea that complex stories can be told with just a single still image.

What is the name the above chart?

What is the name the above chart?
Thursday, August 30, 2007
Did Someone Say, Volatility?
Let's see, on Tuesday, August 28, the DJIA was down 280 points or -2.1%. Then, the next day, Wednesday, August 29, the DJIA was up 247 points or +1.9%. Wow! Market schizophrenia rules the day.
This market is just waiting for Bernanke and friends to make of their minds on what to do about the Fed Funds rate. First, the discount rate was cut to 5.75%, which did calm the markets somewhat. However, you can not tell that by the past Tuesday and Wednesday. Second, the market is now anticipating that the Fed is going to cut the Fed Funds rate before its next scheduled meeting, which will be held on September 18. The cut in the discount rate was nothing but symbolic. The discount rate, a lagging rate, follows money market rates. So, if anything, it was probably a shrewed move by the Fed. I guess market participants should go back an revisit their Money and Banking course to get a quick refresher on Monetary Tools. If the Fed really wants to be serious about providing liquidity to the banking system, the recommended policy would be to reduce the reserve requirement ratio that depository institutions (banks) must hold on their deposits (liabilities). This action would immediately provide instant liquidity by way of excess reserves. These are the reserves that banks can loan out. May be the Fed could surprise us a cut these requirements, which would immediately tell me that the subprime and condo problem is a whole lot worse than most investors think it is.
If we get the cut in the Fed Funds rate or reserve requirement ratio, investors must watch the performance of the financial sector, consumer sector, and utility sector for clues of the overall strength to the economy. However, these three sectors need to start out performing the S&P 500 and penetrate their well defined resistance lines. So far, they have not outperformed the market. The following charts depict the performance of the three sectors relative to the S&P 500:


Stay tone. Things are going to get really interesting, very shortly.
Tuesday, August 28, 2007
Housing Prices: Steepest Drop in 20 Years
Standard & Poor reported today that U.S. home prices fell 3.2 percent in the second quarter. This is the steepest rate of decline in the housing index since 1987 when S&P first started tracking the index. The decline in home prices around the nation shows no evidence of a market recovery anytime soon.
Here is another sober thought to ponder that was stated in the recent issue of Barron's on August 27, "Up & Down Wall Street," There are over $1 trillion of securitized low-grade mortgages (subprime) outstanding and nearly three-quarters of a trillion dollars worth of mortgages whose adjustable rates are stated to rise over the next year."
The message from the above two reports assures us that the economy is about to experience an appreciably larger magnitude of pain in the months ahead. This is why I am now totally convinced that the Fed will not only cut the Fed Funds rate by 50 basis points but will provide sufficient liquidity (money) to save the entire banking system. When the Fed re-inflates, and they will, with a passion, the dilemma for them is the negative impact such a monetary policy has on the dollar.
Stay tone because all of this will come to the forefront in September. Oh, I forgot to mention that September will also bring earnings reports from banks and brokerages that will reveal the extent of their "losses" from subprime investments.
Monday, August 27, 2007
Markets at a Glance
For the week ended August 24, the DJIA advanced nearly 300 points. On Friday, August 24, the DJIA was up 142.99 points, NASDAQ was up 34.99, and Oil gained $1.26 to $71.09. It seems that the market has now fully priced in a 25 to 50 basis point cut in the Fed Funds rate by the Fed when they meet on September 18. If the Fed does not cut this key lending rate, the market will definitely go back and test the lows of August 16. Even if the Fed does cut the Fed Funds rate, there is a good chance the market will still decline; because of that Wall Street axiom that states, "buy the rumor, sell the news."
What about this week? The subprime real estate bubble will continue to dominate the market. Last week's infusion of $2 billion into Countrywide Financial by Bank of America still leaves more unanswered questions, especially in the funding area for Countrywide. Now, we are hearing that condominiums have their own set of defaults and foreclosures. Major markets across the country, especially in parts of Florida, California, and Washington, D.C., are seeing rising foreclosures and bankruptcies of entire condo projects.
Another concern, near term, is that the market has been rising on low volume, which equates to lack of conviction. Also, the months of September and October have not been kind to the markets.
Monday, August 20, 2007
Presidential Cycle: Third-Year Correction
The "Contrary Investor" provided the following data on the third-year corrections from market highs to market lows for Presidential Cycles; which is very informative, given the current market conditions and, of course, we are in that third-year cycle now.


The corrections during the third-year of the Presidential Cycle had a mean and median declines of 9.8% and 9.2%, respectively, for the S&P 500. If we look at the current declines from the market highs of July 19 to the current lows of August 16, we have the DJIA down 11.79%, S&P 500 down 11.87%, NASDAQ down 12.41%, and the Wilshire 5000 down 12.4%. These declines are all within the parameters for the third-year Presidential Cycle declines and the normal corrections within a bull market. Therefore, as long as the "critical-mass levels," which were mentioned in the previous post hold and the 17-week EMA holds above the 43-week EMA, the bull market remains as such.
Time for an Update: Bear Market, Yet?
From my posting of Friday, March 2, 2007 (please read the entire post), I said, "Tuesday’s (February 27) market plunge of over 400 Dow points has drawn a lot of attention from the media. However, on a relative basis the decline was 3.3%, which, in fact, was the first significant decline since this “bull” rally started approximately five years ago. Typically, corrections during bull markets are anywhere from 10% to 12%. This 3% decline is nowhere near other bull market corrections. Don’t let all the media hype about this correction lose site of the fact that we are still in a bull market."
I also said on Friday, March 2, 2007, "Now, at what levels on the DJIA and S&P 500 will negate or call into question this current bull market? For the DJIA, the level is 11,783, or 4.5% from the current level. For the S&P 500, the level is 1,358 or 3.2% from the current level. At these levels, I would definitely become concern."
Given the market's frenzy over the past two weeks, are we to those levels on the DJIA and S&P 500 that I mentioned back in March 2007 where I would get very concerned? The answer is "NO." The low on August 16 for the DJIA was 12, 455.92. For the S&P 500, the low on August 16 was 1370.60. Since August 16, the DJIA and S&P 500 are up 5% and 6%, respectively, from their lows. Keep-in-mind that corrections during bull markets are usually 10% to 12%. So far, the recent corrections from the July 19 high to the August low on the DJIA and S&P 500 have been 11.79% and 11.87%, respectively.
Saturday, August 11, 2007
S&P 500: Long-Term Perspective
One of the important features of being a long-term trend follower is that it eliminates all the daily "market noise." From my perspective, an investor wants to be fully invested during the "Bull" phase and short, or in cash, during the "Bear" phase. This is nothing more than adhering to the Wall Street adage of buying low and selling high. However, investors usually have a very difficult time in implementing the adage. A key point for an investor to remember is that one is not going to be able to "buy" at the exact low and "sell" at the exact high. What is important to remember is to be fully invested for 80% of the "Bull" phase and be out of the market for 80% of the "Bear" phase.
How is this investment strategy implemented? The following chart gives the specifics. It illustrates the 17-week and 43-week moving averages of the S&P 500 over the past decade. When the 17-week moving average is above the 43-week moving average, the market is in a "Bull" phase; and an investor should be fully invested. When the 17-week is below the 43-week, the market is in a "Bear" phase; and an investor should either be short or in cash (money market fund). There you have it. This investment strategy is very simple but, yet, very profound. Just check it out. Its performance has been excellent. By the way, an investor would have been out of the market debacle during 2001 and 2002 and in since 2003 following this strategy.
 One other feature of the above chart is the index on the bottom. It is the "Relative Strength Index (RSI)" of the S&P 500. Its significance is that the index remains consistently above 50 during the "Bull" phase and consistently below 50 during the "Bear" phase.
How is this investment strategy implemented? The following chart gives the specifics. It illustrates the 17-week and 43-week moving averages of the S&P 500 over the past decade. When the 17-week moving average is above the 43-week moving average, the market is in a "Bull" phase; and an investor should be fully invested. When the 17-week is below the 43-week, the market is in a "Bear" phase; and an investor should either be short or in cash (money market fund). There you have it. This investment strategy is very simple but, yet, very profound. Just check it out. Its performance has been excellent. By the way, an investor would have been out of the market debacle during 2001 and 2002 and in since 2003 following this strategy.

Thursday, August 02, 2007
Seasonal Performance: Halloween Indicator Update
The S&P 500 is down 2% from May 2007. So far, the Halloween Indicator (Sell, end of April; and Buy, end of October) has been true to form.
Thursday, May 03, 2007
Halloween Indicator Performance Record Since 1950
Thanks to the "Contrary Investor" for the following chart on the Halloween performance over the past 56 years. Wow!
 With the raw data, I calculated the mean return, standard deviation, and the coefficient of variation. The results are as follows: May/October had a mean return of 1.52%, standard deviation of 8.55%, and a coefficient of variation of 5.64. November/April had a mean return of 7.30%, standard deviation of 10.08%, and a coefficient of variation of 1.38. Finally, a Buy/Hold strategy had a mean return of 0.74%, standard deviation of 4.07%, and a coefficient of 5.53.
Any questions about the power of seasonality within the stock market? I didn't think so. Another way of looking at the above performance is as follows: "One dollar invested in 1950 using only November through April investment periods each year has grown to just shy of $43 today. Alternatively, one dollar invested only in the May through October periods since 1950 is today worth less than $2."
Thursday, April 26, 2007
MBA 642: May 1 Assignments and Readings on Interest Rate Parity and Arbitrage
Interest rate parity is the situation that exists when the expected rate of return on riskless securities is the same in all countries. If the expected rate was higher in one country than another, money would flow to the country with the higher rate. The process would increase the rates in the low-rate country and lower rates in the high-rate country. The process (arbitrage) would continue until rates were equal (parity existed).
For example, say $856.90 is converted to Canadian dollars at an exchange rate of 1.1670 CDW to $1 to buy a CDW1,000 6-month bond that pays an annual rate of 4%. At the end of 6 months, the investor would receive CDW1,020. If the exchange rate remains the same, the Canadian dollars can be converted into $874.03 (1,020/1.1670), which translates into a 4% annual rate of return. But suppose the Canadian dollar is expected to appreciate against the U.S. dollar, and so the forward rate is 1.1614 CDW per U.S. dollar. Then, the CDW1,020 will buy $878.22 (1,o20/1.614). This gives an annual rate of return of 4.98%. Thus, the investor earns 4% on the Canadian investment and then gains 0.98% on the appreciation of the CDW that leaves the net return of 4.98%. Therefore, given the prior assumptions, a 4% Canadian rate implies that the U.S. riskless rate on a 6-month bond should be 4.98%. If the U.S. and Canadian rates were the same 4%, then U.S. money would flow to Canada, driving down Canadian rates and driving up U.S. rates, until equilibrium has been reached (interest rate parity).
For Tuesday, May 1, read pages 944-966 of Chapter 27 "Multinational Financial Management." Focus your attention on the section entitled, "Trading in Foreign Exchange -- Interest Rate Parity." Do the following problems for Chapter 27: 2, 3, 9, 10, and 11.
In addition, refer back to the post of April 23 entitled, "Interest Rate Parity" and answer the question on the Indian INR arbitrage. Also, complete the arbitrage question from the handout on the Dollar and SF.
Monday, April 23, 2007
MBA 642: Interest Rate Parity
The spot rate for the Indian INR is 48.50/$1. The current interest rate in India for a 3-month CD is 10%. In the U.S., the rate is 4%. What is the implied 3-month forward rate? If you are quoted a 3-month forward rate of 48.75/$1, what should you do?
A good site for a currency converter on over 164 currencies is at Oanda.
A good site for a currency converter on over 164 currencies is at Oanda.
Wednesday, April 18, 2007
MBA 642: De-Leverage ???
Leveraged investors have borrowed in a number of currencies to invest in higher rates of return in the world. Specific currencies of interest in the “carry trade” would include the Yen and Dollar. If the de-leveraging process were to become meaningful, we would expect the Yen to rise in value as part of the unwinding process. In other words, levered investors would be selling assets and buying the Yen. Keep an eye on the relative performance of the S&P 500 relative to the Yen ($SPX:$XJY) for possible clues about the chances of de-leveraging as it relates to the unwinding of the Yen carry trade. Also, monitor the FXI, which is the ETF for the Shanghai Composite Index, for additional clues to the de-leveraging process.
For Tuesday, April 24, be prepared to comment on the outlook for the Yen and Dollar.
You may want to check out the following link for the dollar.
For Tuesday, April 24, be prepared to comment on the outlook for the Yen and Dollar.
You may want to check out the following link for the dollar.
Monday, April 16, 2007
MBA 642 Financial Management
For Tuesday, April 17, we will focus on "Lease Financing" (Chapter 19). The problems for this chapter are 3 and 4.
In addition, we will review for your assessment next week. You will be responsible for the following concepts: DuPont Formula and its Applications, P/E Valuations, Cost of Capital Applications, Evaluating Cost of Equity through CAPM, NPV with Replacement Chain Analysis, and Coefficient of Variation.
Note: Please remember those families who have lost love ones at Virgin1a Tech.
Friday, April 13, 2007
Risk Management Indicators
The following chart comes from “BigCharts.com,” which is an excellent “free” charting service by the way. Please draw your attention to the 17 and 43 exponential moving averages. These moving averages just might make or save you a bundle of money.


What does the above S&P 500 chart with its moving averages demonstrate and how can it assist you in making investment decisions? First, the 17 and 43 weekly exponential moving averages (EMA) do not cross every week. However, when they do (17 EMA crosses below 43 EMA), investors better take notice! Second, using the 17 and 43 weekly EMA, an investor would have gotten out of the S&P 500 in October 2000 when the 17 EMA crossed below the 43 EMA and stayed out until early May 2003 when the 17 EMA crossed above the 43 EMA and would have been fully invested ever since. Not too bad of an indicator because the investment game is won by “minimizing” one’s losses.
Along with the Halloween Indicator, this indicator has proven to be a real “winner.”
Along with the Halloween Indicator, this indicator has proven to be a real “winner.”
Thursday, April 05, 2007
MBA 642: Assignments
For Tuesday, April 10, be prepared to discuss the problems from Chapter 12 that were assigned. Also, for Chapter 12, read and study pages 418 to 422 on "Cash Flow Evaluation with Unequal Lives and Economic Life vs. Physical Life (Optimal Life)." Then, look at the "Minicase" on pages 432-433 and do "k and l."
In addition, read pages 454 to 464 (Chapter 13) on "Techniques for Measuring Stand-Alone Risk." Then, do problems 7 and 8.
In addition, read pages 454 to 464 (Chapter 13) on "Techniques for Measuring Stand-Alone Risk." Then, do problems 7 and 8.
Saturday, March 31, 2007
FINC 431 Finance: Assignment
The assignment for Thursday, April 5, is to do the following problems from Chapter 13 Risk and Capital Budgeting: 1, 3, 8, 10, 12, 13, 15, 22, and 23.
In addition, we will have some lab time so that each group can calculate its stock "beta."
In addition, we will have some lab time so that each group can calculate its stock "beta."
Friday, March 30, 2007
Market Quote
"A bull market tends to bail you out of your mistakes. Conversely, bear markets make you pay for your mistakes." (Richard Russell)
DJIA Monthly Gains
The following chart comes to us from "Chart of the Day." This chart illustrates the DJIA's performance for each calendar month since 1950 (blue columns) and 1980 (gray columns). What does the chart demonstrate? Well, while the strongest month for stocks, as measured by the DJIA, has historically been November or December, April has tended to be the second strongest month of the year. Bring it on! Oh, you may want to go back and review the Halloween Indicator that was posted on October 26, 2006.


Wednesday, March 28, 2007
MBA 642: Yen Carry Trade
You borrow 1000 yen at 1%. You redeploy the yen into dollars to purchase TSY securities that are yielding 5%. At the time the trade is instituted, $1 = ¥118. One month later $1 = ¥100. What are the financial ramifications of the trade? That is, provide me with the return on your investment. Email your results to me by Monday, April 2.
MBA 642 Financial Management: April 3 Assignment
The assignments for April 3, 2007 are as follows:
1. Calculate the "Forward Looking Market Risk Premium" for your stock.
2. Determine the price set-up for your stock using "Technical Analysis."
3. Chapter 12 Capital Budgeting (Problems 1, 2, 3, 5, 7, and 12)
1. Calculate the "Forward Looking Market Risk Premium" for your stock.
2. Determine the price set-up for your stock using "Technical Analysis."
3. Chapter 12 Capital Budgeting (Problems 1, 2, 3, 5, 7, and 12)
Wednesday, March 21, 2007
MBA 642 Financial Management: Assignments
For Tuesday, March 27, your assignments are as follows:
1. Chapter 8 Analysis of Financial Statements (Problems 3, 4, and 5)
2. Chapter 10 Determining the Cost of Capital (Problems 1, 2, 3, 5, 6, 9, and 10). In estimating the risk-adjusted rate of return, our authors use the rate on the 10-Year TSY Note as the risk-free rate of return. Why? What is the rationale for using the 90-Day TSY Bill rate as the risk-free rate? What is the appropriate "Market-risk Premium" to use? Explain. Review "Estimating Market Risk Premium" on pages 324-326, especially "Forward-looking Risk Premiums.
3. Market Bounce Data: $SPXA50 (Level 100?), 10-day MA of $CPCE (Range .72 to .75?), and 60-day MA of $CPC (Level of 1.05+)
4. Technical Analysis: Price Set-ups for TLT
5. Beta Analysis: Group Endeavor
6. Million Dollar Challenge Update
Thursday, March 15, 2007
FINC 431 Finance
For our next class session on March 29, be prepared to discuss the following items:
1. Read pages 359-366 of your text on the "Capital Asset Pricing Model (CAPM) and Securities Market Line (SML).
2. Read Chapter 13 on "Risk and Capital Budgeting."
Have a great Spring Break!
1. Read pages 359-366 of your text on the "Capital Asset Pricing Model (CAPM) and Securities Market Line (SML).
2. Read Chapter 13 on "Risk and Capital Budgeting."
Have a great Spring Break!
Saturday, March 03, 2007
Market Bounce! From What Level?
The following three indicators have provided levels where the markets have bounced after going through corrections:
1. The first is the number of S&P 500 stocks above their 50-day MA ($SPXA50). Levels of 100 or lower are usually associated with market lows. As of Friday, March 2, it stood at 170.
2. The 10-day MA of the CBOE Options Equity put/call derivative indicator ($CPCE) has been good at identifying bottoms at levels between .72 to .75. As of Friday, March 2, it stood at .73.
3. The 60-day MA of the CBOE Options Total Put/Call derivative indicator ($CPC) will "flash" a bottom above 1.05. As of Friday, March, it stood at .94.
Will these indictors "flash" a buy this time? Time will tell!
Friday, March 02, 2007
MBA 642 Financial Management: Assignments
For Tuesday, March 6, the assignments are as follows:
1. Chapter 4 (Bonds) -- Problem 14
2. Chapter 7 (Financial Accounting) -- Determine the "Free Cash Flow" for AAPL. Bring to class the financial statements for AAPL.
3. Chapter 5 (Basic Stock Valuation) -- Problems 2, 3, 4, 5, 6, 9, and 11
4. Be prepared to discuss the investment events of the past week and its significance, if any. Would you be a buy/seller of TLT and/or IWO? Check the chart postings on the blog for assistance with this question.
5. Portfolio Challenge (CNBC)
6. Calculating the Odds of a Recession: Go to the following site that is entitled "Political Calucations" and make you forecast. Use the data from Bloomberg in making your forecast. This is a very interesting exercise.
DJIA Performance: Average Third Year of Presidential Cycle

Tuesday’s market plunge of over 400 Dow points has drawn a lot of attention from the media. However, on a relative basis the decline was 3.3%, which, in fact, was the first significant decline since this “bull” rally started approximately five years ago. Typically, corrections during bull markets are anywhere from 10% to 12%. This 3% decline is nowhere near other bull market corrections. Don’t let all the media hype about this correction lose site of the fact that we are still in a bull market.
Look at above chart and recognize that two of the best performing months are March and April during the third year of the Presidential Cycle. Also, go back and revisit the “Halloween Indicator.”
Now, at what levels on the DJIA and S&P 500 will negate or call into question this current bull market? For the DJIA, the level is 11,783, or 4.5% from the current level. For the S&P 500, the level is 1,358 or 3.2% from the current level. At these levels, I would definitely become concern.
Wednesday, February 21, 2007
Calculating Free Cash Flow (FCF)
Think of free cash flow (FCF) as another bottom line. Negative free cash flow isn't necessarily bad, but it suggests you're dealing with either a speculative investment or an underperformer. Above all, negative free cash flow usually equates to a high level of capital spending that naturally raises other questions. If the company is spending so much money on capital projects, is it at least earning a high return on that capital? Is the company’s IRR > WACC? And is all that spending paying off in rapid sales and profit growth?
The relevancy of free cash flow is that it represents “real cash,” earnings do not.
Calculation for free cash flow is as follows:
1. FCF = NOPAT – Net Investment in Operating Capital
a. NOPAT = EBIT(1-Tax Rate)
b. Net Investment in Operating Capital = [Cash + Accounts Receivable + Inventories – (Accounts Payable + Accruals)] (Net Operating Working Capital) + Operating Long-term Assets (Net Plant and Equipment)
2. FCF = (NOPAT + Depreciation) – Gross Investment in Operating Capital
a. NOPAT = EBIT(1-Tax Rate)
b. Gross Investment in Operating Capital = [(Net Operating Working Capital + Operating Long-term Assets) + (Depreciation)]
Uses of FCF
1. Pay interest to debt-holders
2. Repay debt-holders
3. Pay dividends to shareholders
4. Repurchase stock from shareholders
5. Purchase marketable securities or other non-operating assets
MBA 642 Financial Management: Million Dollar Challenge!
Next Tuesday, February 27, I am going to have Dr. Oglesby place the class into teams. Each team will select a facilitator and proceed to register for the "Million Dollar Portfolio Challenge" that is being sponsored by CNBC. I thought this would be a great way to see if any of you can win the million dollars. Thanks to Daniel Webster for bringing this to my attention.
Once the facilitator is selected, he or shee will register his/her team on CNBC for the “Portfolio Challenge.” See instruction below. I will the computer lab open so that each group can start the million dollar process. Good luck!
1. Go to CNBC (http://www.cnbc.com)
2. Click-on “Investing Tool.”
3. Click-on “Portfolio Challenge” to register.
4. Complete the registration procedure.
5. Challenge starts March 5, 2007
Stock Market Rallies
As we start to look at the various stock valuation models, it is always a good ideal to reflect upon where the market is today in relation to its performance and length of its current bullish trend.
As the following chart indicates, the current bullish rally is approximately 4.5 years in duration, which is long by previous market rallies. In addition, its current performance during this rally is approximately +75% over the past 4.5 years, which is lags behind previous market rallies. Also, the current rally is below its linear-regression trend line. Will we have a revision to the mean (point on the line) or will this market rally continue to underperform?

As the following chart indicates, the current bullish rally is approximately 4.5 years in duration, which is long by previous market rallies. In addition, its current performance during this rally is approximately +75% over the past 4.5 years, which is lags behind previous market rallies. Also, the current rally is below its linear-regression trend line. Will we have a revision to the mean (point on the line) or will this market rally continue to underperform?

Monday, February 05, 2007
Fama and French Three-Factor (Predictor) Model
CAPM uses a single factor, beta, to compare a portfolio with the market. Why use more factors (predictors)?
Fama and French started with the observation that two classes of stocks have tended to do better than the market as a whole: (1) small caps [SML] and (2) stocks with a high book-value-to-price ratio [HML]. When they tested their hypothesis, they found small companies and companies with high B/M ratios had higher rates of return than the average stock (just as they hypothesized). Somewhat surprising by their research, however, they found no relation between beta and return.
They added two additional factors (predictors) to CAPM to reflect a portfolio’s exposure to size and B/M. The three-factor model is as follows:
ri = rf + bi(MRP) + ci(SMB) + di(HML) + alpha
One thing that is interesting is that Fama and French still see high returns as a reward for taking on high risk. For example, if returns increase with B/M, then stocks with high B/M ratio must be more risky than low B/M. Why?
Buy, Hold, or Sell
From the following weekly chart of IWO, determine the relationship between and among Commodity Channel Index (CCI), Full Stochastics, and Percentage Price Oscillator (PPO) in relation to forecasting the price direction of the underlying security?


OER or It's All About Data Analysis
From your analysis of the article (Manning the OER), which will be handed out in class, why are intermediate (10 year) and long (30 year) Treasuries not rallying in the face of “OER’s” weakness? Also, the Fed’s target for core inflation is between 1% and 2%. What is the current core inflation rate? In addition, what is the prospect for the core inflation rate during 2007?
Sunday, February 04, 2007
January Indicator of Future Stock Performance
As goes January, so goes the year. This particular phenomenon is what is referred to as the “January Barometer.” The following chart, which is from “Chart of the Day.com,” presents the average performance of the S&P 500 one, three, six, and 11 months following a January gain (blue bars) and following a January loss (gray bars). The chart illustrates that the S&P 500 has performed much better (on average) during the months following a January gain. In fact, 11 months following a January gain; the S&P 500 was up 89% of the time. For January 2007, the S&P 500 was up 1.4%.


The "January Indicator" has an impressive record. Does the indicator imply that since the market was up in January that eleven months from now the S&P 500 will rise over 12%? Evaluate the aforementioned question. In your evaluation, what type of information would you want to know?
Saturday, January 13, 2007
Declining CRB Index Signifies Economic Weakness
In their latest weekly update, Comstock Partners, Inc. provided an interesting analysis of their findings of the recent decline in the "CRB Index." Quote:
"The idea that falling crude oil prices will boost the economy and overcome the plunge in housing is yet another instance of hope replacing reality. Despite its great importance, oil is just another commodity that goes up and down with the business cycle. When the economy begins to weaken commodity prices go down; when the economy is strong commodity prices go up.
Since its May high the CRB commodity index has dropped 22%, only the 7th time this has happened since 1974. According to ISI, since 1974 every decline in the index of 20% or more has been associated with either a recession, a significant slowdown or a financial crisis. Each of these periods has also occurred following a period of tight money and an inverted yield curve. In this regard it is also noteworthy that oil has not been the only commodity declining in price. Recent months have featured significant declines in a wide assortment of commodities such as copper, gold, sugar, hogs, wheat and corn. It is therefore likely that the oil price decline is itself a result of economic softening rather than an impetus to growth.
ISI also points out a number of other factors historically associated with significant economic slowdowns including the lagged effect of 17 rate hikes; the decline of house prices; the plunge in mortgage equity withdrawals (MEW); the inverted yield curve; significant slowing in the leading indicators; tightening by foreign central banks; and nominal GDP growth under the fed funds rate.
Source: http://www.comstockfunds.com
Friday, December 01, 2006
The Economy
The "Big Picture" had an interesting perspective on the economy, which is provided as follows:
"On CNBC, the pundits are talking about how the most recent spate of data has put Goldilocks scenario in danger. I must admit to finding it amusing how much faith so many players had put into Goldilocks, a most unusual and unlikely scenario.
The latest data forces me to revise my 50% possibility of a recession in 2007/08 up to 60%. GDP for Q4 '06 is likely to be between 0.5% - 1.5% (or worse, if Holiday sales keep trending softer).
As far as the Fed, this data suggests that the jawboning about inflation will remain just that -- while we still expect the Fed to cut before 2007 comes to an end, the odds of a hike anytime soon have just dropped significantly.

Inventory build, government spending and imports, was responsible for virtually all of the 0.6% upward revision in GDP. Consumption, 70% of the US economy, is slowing.Revised higher:
Government spending (0.05%)
Inventory Build (0.26%)
Imports (0.39%)
Revised lower:
Exports were revised 0.2% lower.Consumption was revised 0.14% lower
Why are Businesses inventories increasing? Some pundits have claimed this is a bullish sign, an "anticipation of increased demand." I doubt this. We have seen recent CEO surveys which point to major negative sentiment amongst the usually cheery Execs; Durable Goods tumbled 8%, and Housing and Autos are likely already in a recession. My guess is that Just-in-time-inventory is easier to ramp than it is to slow down.
And while Reuters reported that "Business spending on inventories rose, increasing sharply to a $58 billion rate from the $50.7 billion earlier estimated." Inventories builds have increased at a faster than usual pace -- implying that this was (whoops!) unintentional.
Given the drop in both Durables and Capex, I am somewhat incredulous over Business spending being revised upward to show a 7.2% gain (versus 6.4% advance)."
Source: http://bigpicture.typepad.comSaturday, November 25, 2006
Determination of Exchange Rates
The following chart illustrates the "plummeting $."

What is going on with the extreme weakness in the dollar (at a 19-month low)? What is causing the $USD to be so weak? From Chapter 21, which is entitled International Financial Management, we can make an inference as to the recent $USD weakness. Read pages 603-611 that provide insight for each of the following exchange rate determinates of the $USD: Income and taste, Changes in relative interest rates, Changes in relative price levels, Changes in fiscal and monetary policies, Changes in Balance of Payments, and Other Factors such as Oil Prices and SOX or SarbOX Act.
For Tuesday, October 28, be ready to discuss the causes for the $USD weakness.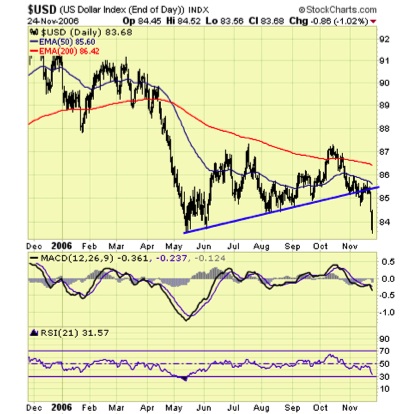
Saturday, November 11, 2006
Yield Curve Says "Probable" 2007 Recession
John Mauldin notes:
"The yield curve became more inverted this week, with the negative differential between the 3-month and the 10-year at -49 basis points and a -76 basis point differential between the 10-year and the Feds fund rate. According to a Fed paper, that level of an inversion suggests there is now an over 40% probability of recession next year. This same model only predicted a 50% chance of recession in 2000, and as the paper authors acknowledge, the model probably understates risk in recent decades."
The yield curve and interest-rate data looks like this, which is from Bloomberg.com:

Source:
John Mauldin
Investor Insight, November 10, 2006
http://www.frontlinethoughts.com/article.asp?id=mwo111006
Thursday, November 02, 2006
Free Cash Flow (FCF)
"Free Cash Flow (FCF)" represents the cash that a firm is able to generate after expending all the money to maintain/expand its assest base. In addition, investors like firms that produce lots of FCF; because it allows a firm to purse investment opportunities that enhance shareholders' wealth.
To calculate FCF, go to a firm's cash flow statement. There you will find the line item entitled "Total Cash Flow From Operating Activities." From this number, subtract the number from 'Capital Expenditure," which is found in the next section of the Cash Flow statement entitled "Investing Activites."
For your firm, calculate the FCF for the past three fiscal/calendar years and trend the data. What is the trend? Keep-in-mind that a negative FCF is not necessary bad. It could be the result of some large capital expenditures, which in itself could prove to be highly profitable.
Thursday, October 26, 2006
Halloween Indicator
The stock market is now entering what has historically been the strongest half of the year. The following chart, which is from "Chart of the Day," illustrates that investing in the S&P 500 from the last trading day in October, which is why it is referred to as the Halloween indicator, through the end of April accounted for the vast majority of S&P 500 gains since 1950. While there are some noteworthy periods in which the Halloween indicator didn't produce (i.e. 1973-74 & 2000-01), the overall performance is compelling. Therefore, on Tuesday, October 31, buy the S&P 500 Index and hold it until the last trading day of April, which is the 30. Place the proceeds in a "Money Market Account" until the last trading day in October 2007. Perfect formula for worry-free investing. And who said that investing is difficult. Trick or treat, anyone!
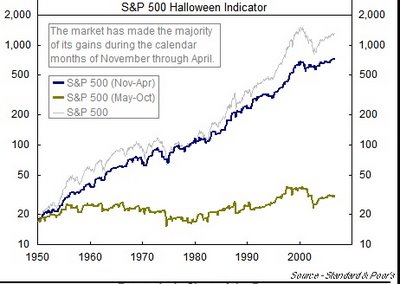
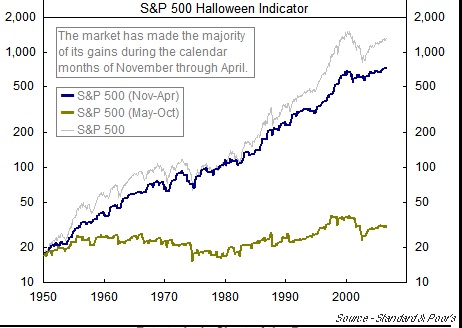
Wednesday, October 25, 2006
Saturday, October 21, 2006
History Lesson
"Stock prices have reached what looks like a permanently high plateau. I do not feel there will be soon if ever a 50 or 60 point break from present levels, such as they have predicted. I expect to see the stock market a good deal higher within a few months." - Dr. Irving Fisher, Professor of Economics at Yale University, one of the most important US economists of his day, speaking on October 17, 1929, a few weeks before the Great Crash.
Thursday, October 19, 2006
All Time High for the DJIA, or Is It?
The DJIA has moved over 12,000 in terms of dollars; but in terms of gold, it remains in a very well-defined "bear market." See the following chart.
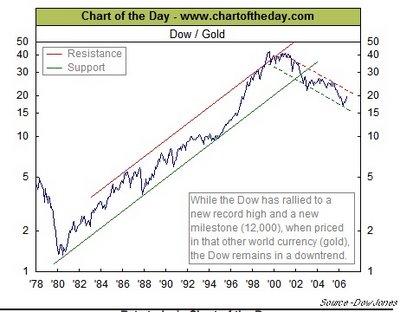 May be we should be purchasing gold, like GLD or GDX, and not equity stocks. What do you think? Make your comments during the coming week.
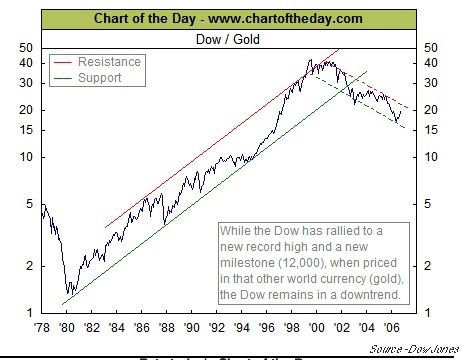
Saturday, October 07, 2006
Goldilocks' Rally?
Core Personal Consumption Expenditures (PCE) inflation is the Fed's favorite gauge of measuring price inflation, which went to a high not seen in 13 years, well above the stated Fed comfort zone near the 2% ceiling. See the following chart that is from the Contrary Investor's report of October 3, 2006:

The reason that I present this chart is because the stock market is indeed anticipating that the Fed will soon be reducing its "Fed Funds" rate (January or March) with the market making a "new" this past week. In addition, the rate on the Ten Year TSY (4.75%) is below the Fed Funds rate (5.25%), which in the past has been an excellent harbinger of lower rates. Go to Bloomberg at http://www.bloomberg.com/markets/rates/index.html to see the current interest rate structures. Also, the decline in energy prices, especially oil and natural gas, along with the expectations that corporate earnings for the third quarter are going to be very robust have helped propel the market higher. But, the stock market has completely ignored the recent inflationary comments by several Federal Reserve members, which does not bode well for a cut in interest rates, along with signs that the economy is slowing, as discussed in last week's post.
On Tuesday, Fed Vice Chairperson Donald Kohn stated that he is more concerned about inflation than slowing economic growth because a recession is unlikely. On Thursday, Charles Plosser, Federal Reserve Chairperson of the Federal Reserve Bank of Philadelphia, stated that the Fed's very credibility was at stake when it came to keeping prices under control. He was clearly concerned that the core PCE inflation is above 2%, and he expressed the need to raise the Fed Funds rate, not lower it. Please remember that he, who has the gold, in this case the money, makes all the rules! And the Fed has all the money, therefore, it makes all the rules as it pertains to the financial markets and the economy. Therefore, don't count on the Fed reducing rates unless inflation, as measured by the PCE, comes down below 2%.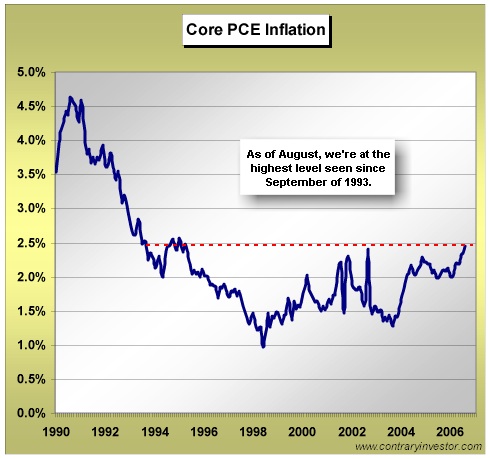
Monday, October 02, 2006
Risk-adjusted Rate of Return (Beta Analysis)
You just justed received your annual performance statement from your investment advisor. The statement indicates thaty your portfolio return for the past year was up 12%. In addition, you noticed within the statement that the S&P 500 rose 10%. Also, the statement gave the portfolio's beta, which means nothing to you, was 1.8. Further on, you read that the TSY Bill rate for the time period was 4.75%. To your dismay, the statement did not provide any further explanation. Therefore, you decide to call your investment advisor for clarification on what this all means. As an investment advisor, what is your response to your client? As the client, are your happy with the performance of the portfolio?
Subscribe to:
Posts (Atom)